US30 H4 Chart Signs of Support and Daily Chart Potential Rotation

US30
FXCM's Dow Industrials proxy, the US30, is showing signs of support. The green short moving average is above the slower orange moving average (blue rectangle). The stochastic is also showing a growing momentum and has moved above 80 (aqua arrow). The longer the stochastic stays in this area the great the likelihood of a swing movement in the US30.
.png)
Past Performance: Past Performance is not an indicator of future results.
US30 vs NAS100
Below we look at the daily relative strength of US30 against the NAS100. The US30 is the numerator and the NAS100 is the denominator. The fact that the green EMA is above the orange EMA and that the RSI has moved above 50, shows that the numerator has started to outperform the denominator. The US30 represents a distinctly cyclical part of the stock market, whilst the NAS100 represents growth stocks. The relative strength here suggests a reallocation of portfolios from growth back into the cyclical side of the stock market.
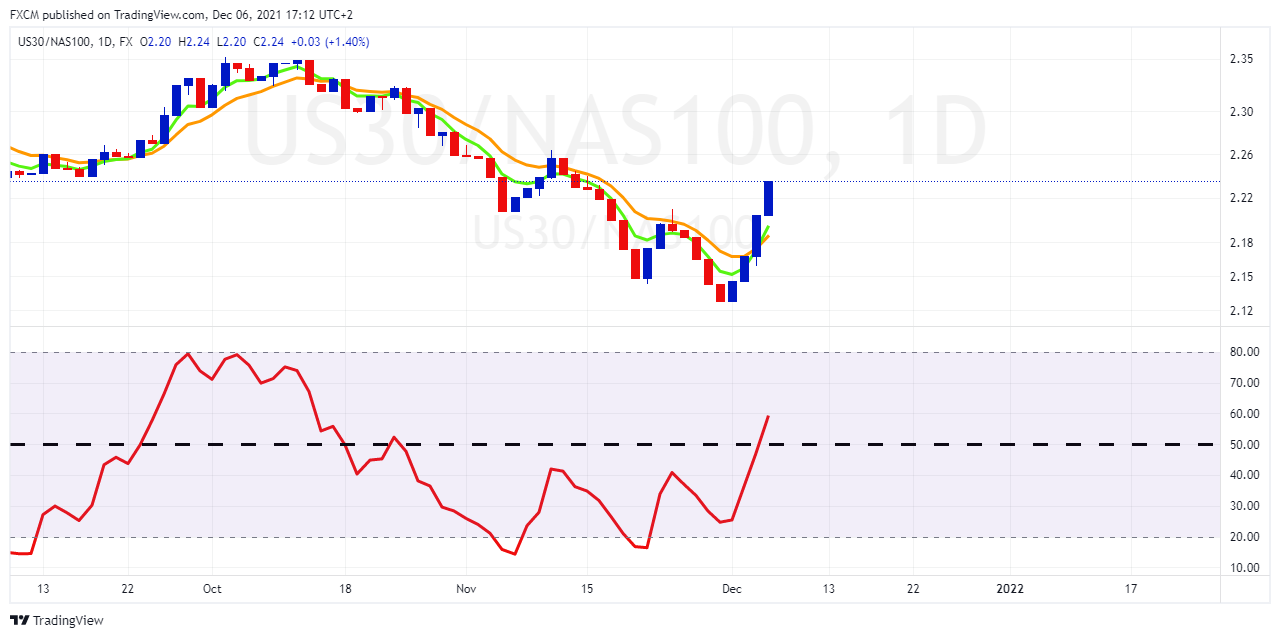
Source: www.tradingview.com
Past Performance: Past Performance is not an indicator of future results.
Conclusion
The support and the rotation of capital for and into the US30 has taken place as the Fed pivots to the hawkish side and as the participation rate ticks up. Higher rates will tend to hit growth stocks hardest and the labour market improvement suggests that the needed solutions provided by growth stocks during lockdown may be on the wane. It is still early with heightened risk from omicron, but if the daily chart's EMAs develop angle and separation whilst the RSI maintains above 50, the relative strength of the US30 and cyclicals is likely to continue.
Image by Pete Linforth from Pixabay
Russell Shor
Senior Market Strategist
Russell Shor is a Senior Market Strategist at FXCM, having been promoted to the role in 2025 in recognition of his depth of insight and consistent delivery of high-impact market analysis. He originally joined FXCM in October 2017 as a Senior Market Specialist.
Russell holds an Honours Degree in Economics from the University of South Africa, is a certified FMVA®, and a full member of the Society of Technical Analysts (UK). With over 20 years of experience in financial markets, his work is renowned for its clarity, precision, and strategic value across asset classes.
Any opinions, news, research, analyses, prices, other information, or links to third-party sites contained on this website are provided on an "as-is" basis, as general market commentary and do not constitute investment advice. The market commentary has not been prepared in accordance with legal requirements designed to promote the independence of investment research, and it is therefore not subject to any prohibition on dealing ahead of dissemination. Although this commentary is not produced by an independent source, FXCM takes all sufficient steps to eliminate or prevent any conflicts of interests arising out of the production and dissemination of this communication. The employees of FXCM commit to acting in the clients' best interests and represent their views without misleading, deceiving, or otherwise impairing the clients' ability to make informed investment decisions. For more information about the FXCM's internal organizational and administrative arrangements for the prevention of conflicts, please refer to the Firms' Managing Conflicts Policy. Please ensure that you read and understand our Full Disclaimer and Liability provision concerning the foregoing Information, which can be accessed here.