GER30 set for expansion in volatility
GER30 Weekly Analysis
.png)
1. The GER30 has charted a series of higher troughs (HT) followed by higher peaks (HP).
1.1 This is a defined uptrend.
2. The green trendline describes the trend's upwards momentum.
2.1 It has been touched twice and is thus regarded as tentative in nature.
2.2 To become a valid trend line, price must respect it a third time.
3. The RSI is on the bullish side of 50 (green rectangle).
3.1 Weekly Signal 1: The longer it maintains on the positive side, the greater the likelihood of further price appreciation.
4. Last week's candle (blue arrow) is a dragonfly doji.
4.1 Bears took price down to the low of the week before losing control to the bulls.
4.2 The bulls pushed price back up and the week closed with the bulls in control.
GER30 Daily Analysis
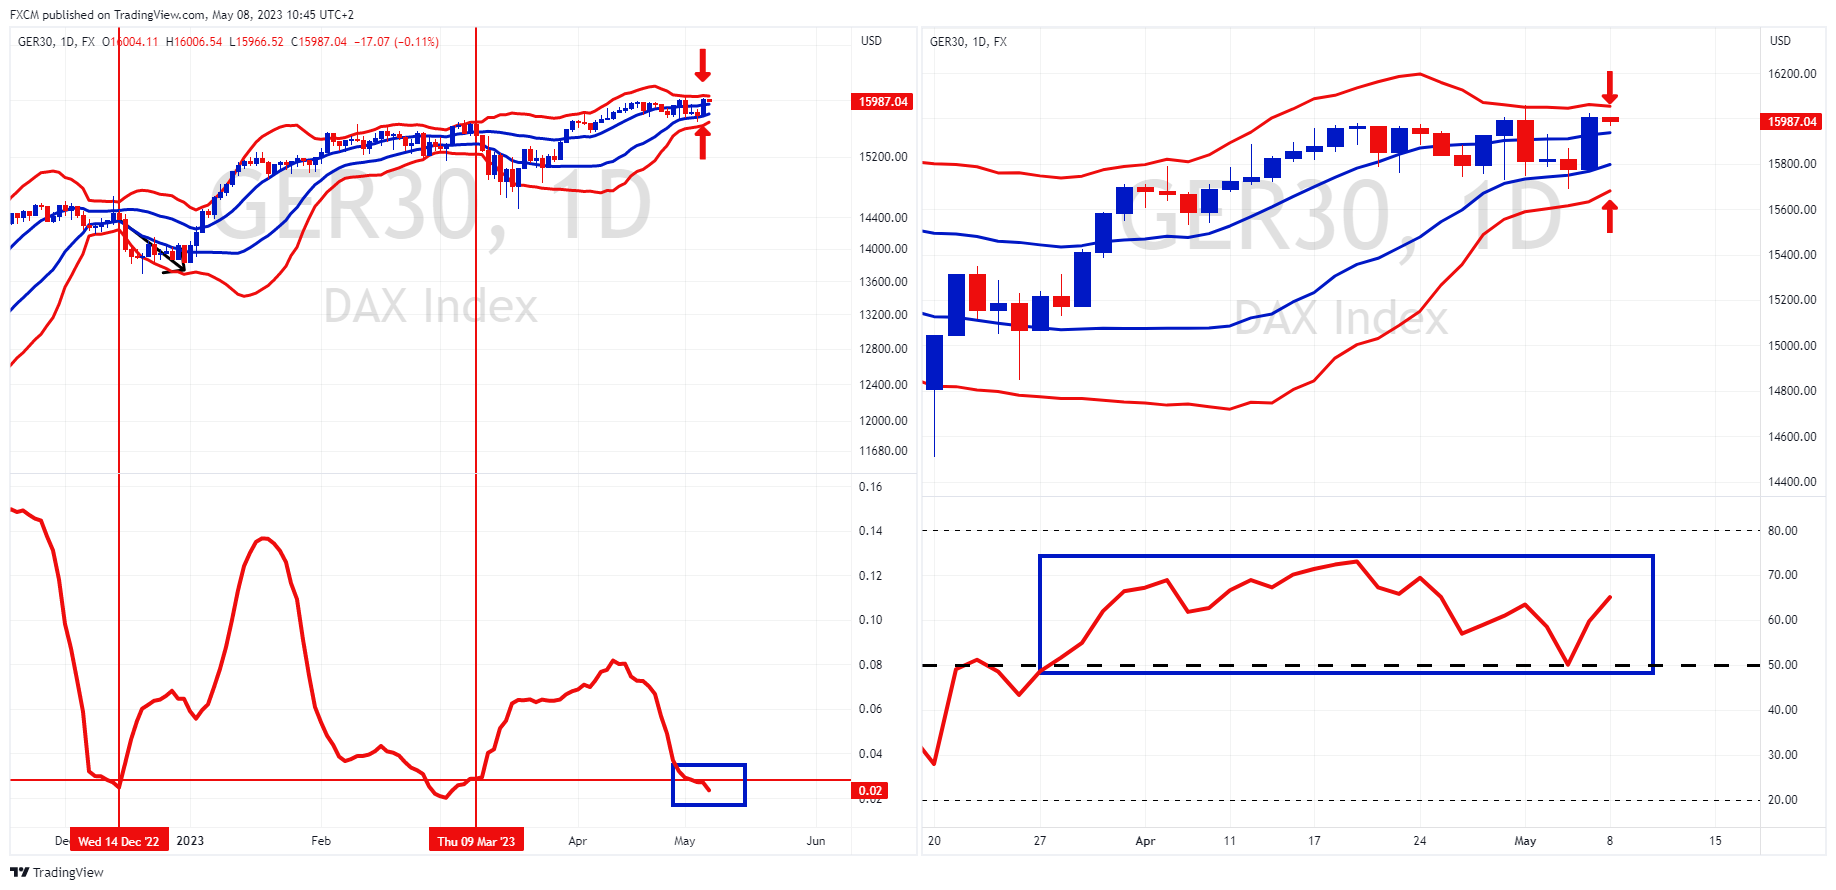
Source: www.tradingview.com
- Bollinger bands suggest a cyclicality to volatility.
- The Bollinger bands are squeezing (red arrows).
2.1 I.e., daily volatility has declined. - The bottom indicator is Bollinger BandWidth.
3.1 Due to the cyclicality of volatility, BandWidth has dropped to a level suggesting a calmness before a volatility expansion (left blue rectangle).
3.2 Previous BandWidth signals (red verticals) have coincided with expansions in volatility to the downside.
3.3 However, in these cases the GER30 was positioned in its weak channel between the lower blue and red bands. - The GER30 is currently positioned in its strong channel between the upper blue and red bands.
4.1 An expansion in volatility accompanied by a strong channel position is bullish in nature.
4.2 Daily Signal 1: Therefore, the longer that the strong channel is maintained the greater the likelihood of higher prices ahead. - The RSI is on the bullish side of 50 and not overbought (right blue rectangle).
5.1 Daily Signal 2:The longer it maintains on this side of 50, the greater the likelihood of higher prices ahead.
Russell Shor
Senior Market Strategist
Russell Shor is a Senior Market Strategist at FXCM, having been promoted to the role in 2025 in recognition of his depth of insight and consistent delivery of high-impact market analysis. He originally joined FXCM in October 2017 as a Senior Market Specialist.
Russell holds an Honours Degree in Economics from the University of South Africa, is a certified FMVA®, and a full member of the Society of Technical Analysts (UK). With over 20 years of experience in financial markets, his work is renowned for its clarity, precision, and strategic value across asset classes.
Any opinions, news, research, analyses, prices, other information, or links to third-party sites contained on this website are provided on an "as-is" basis, as general market commentary and do not constitute investment advice. The market commentary has not been prepared in accordance with legal requirements designed to promote the independence of investment research, and it is therefore not subject to any prohibition on dealing ahead of dissemination. Although this commentary is not produced by an independent source, FXCM takes all sufficient steps to eliminate or prevent any conflicts of interests arising out of the production and dissemination of this communication. The employees of FXCM commit to acting in the clients' best interests and represent their views without misleading, deceiving, or otherwise impairing the clients' ability to make informed investment decisions. For more information about the FXCM's internal organizational and administrative arrangements for the prevention of conflicts, please refer to the Firms' Managing Conflicts Policy. Please ensure that you read and understand our Full Disclaimer and Liability provision concerning the foregoing Information, which can be accessed here.