Market Threads: Is Oil Topping?
.png)
Tracking important market threads across currencies, commodities, and indices.
- Oil at a turning point: momentum fades as Iran talks take centre stage
- Dollar downside builds as oil cools and tensions ease
- Gold is showing early signs of a double bottom as oil softens on easing tensions, setting the stage for a potential bullish breakout.
- JPN225 powers higher as strong momentum and structural tailwinds keep the rally in play.
Cross-Asset View
Falling oil prices on signs of de-escalation between the US and Iran are easing inflation pressure, taking support away from the dollar as rate expectations soften and its safe-haven appeal fades. At the same time, a weaker dollar and lower energy costs are creating a more supportive backdrop for gold, which is benefiting from reduced competition from higher-yielding safe-haven assets.
Oil
Technical Analysis
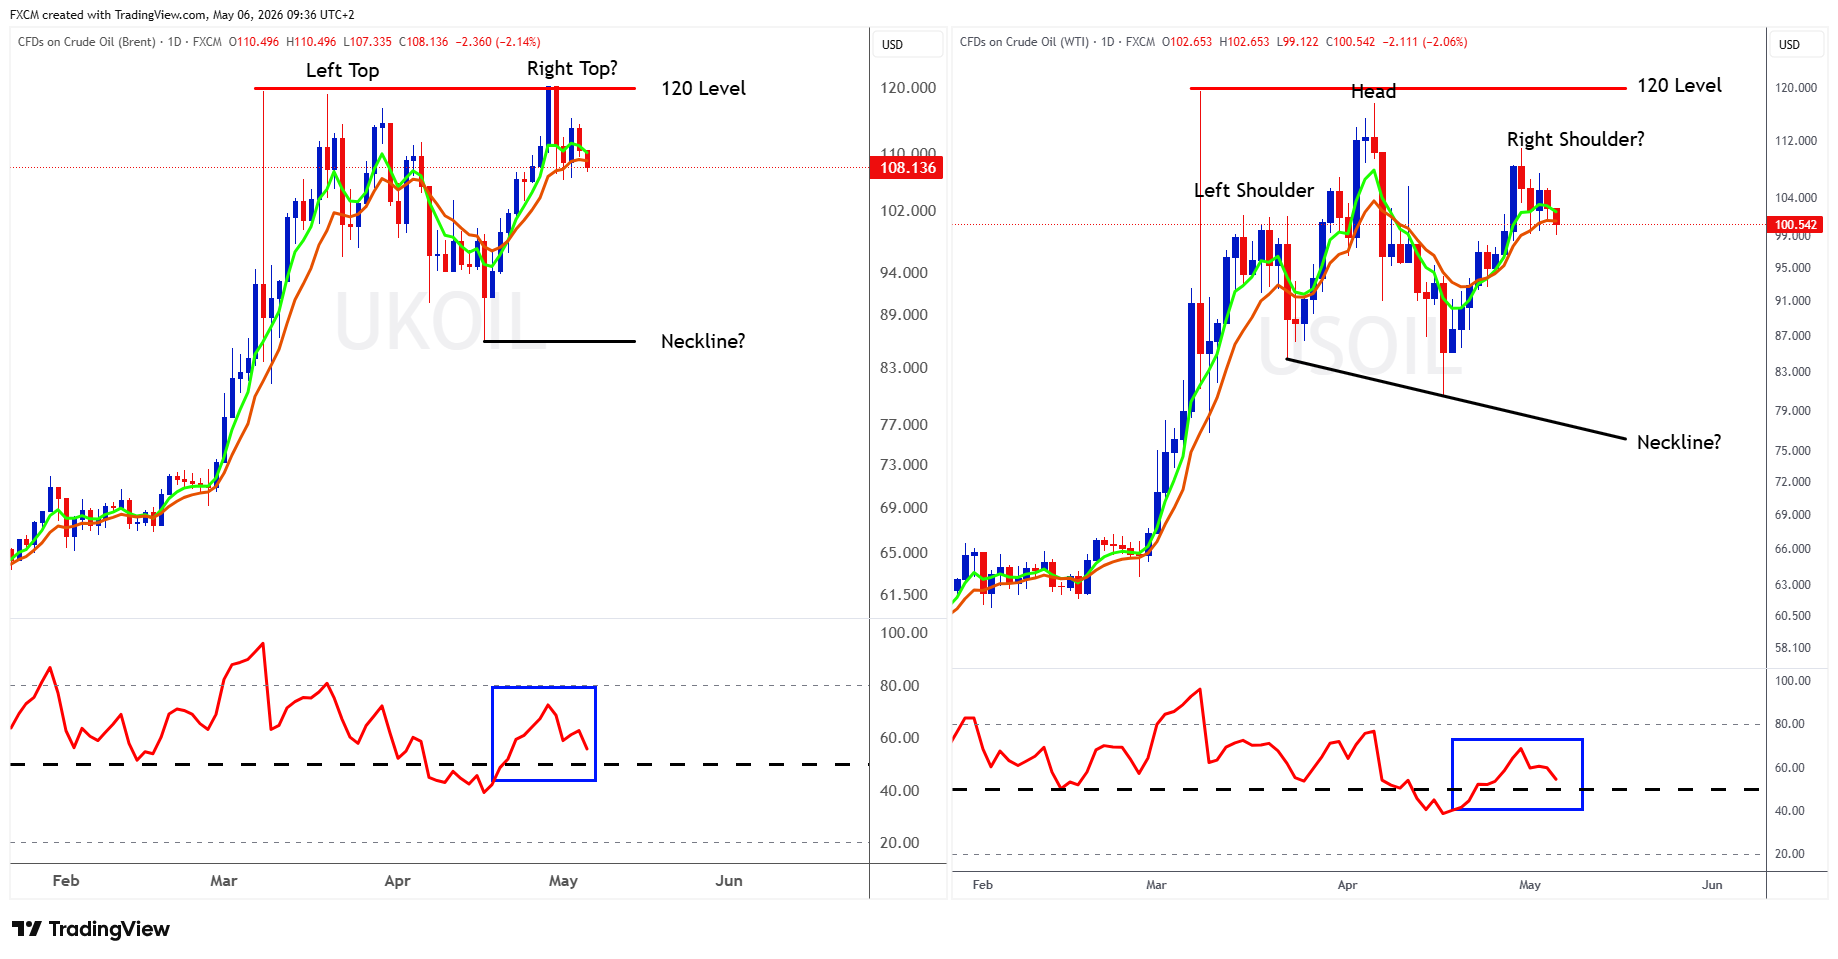
The left chart shows UKOil and the right shows USOil. In both cases, the RSI is above 50, pointing to positive momentum. However, the indicator is drifting towards 50, and a move below that level would shift the momentum outlook to negative.
For now, 120 remains key resistance, with neither UKOil nor USOil managing a decisive break higher. There are early signs of potential topping formations, a possible double top in UKOil and a head and shoulders in USOil, but it is too soon to draw firm conclusions.
These patterns would only be validated on a break below their respective necklines, which are still some distance away. That said, a sustained move in RSI below 50 would signal weakening momentum and support the case for a top forming. If RSI fails to break lower, the bearish view remains premature and will need to be reassessed.
Fundamental Perspective
Oil prices have edged lower as diplomacy returns to focus, with Donald Trump pausing "Project Freedom" to allow time for a potential Iran deal. The pullback reflects easing near-term tension, though a meaningful geopolitical risk premium remains embedded in prices due to ongoing uncertainty around the Strait of Hormuz.
Project Freedom is a US-led military effort to escort vessels through the strait and restore disrupted oil flows. With roughly 20% of global supply moving through this route, the market remains highly sensitive to any disruption.
If progress towards an Iran deal continues, the risk premium should compress and supply flows begin to normalise, shifting attention back to underlying fundamentals. For now, oil is trading on fragile optimism, leaving prices exposed to downside on diplomacy or renewed upside if talks falter.
The USDOLLAR
Technical Analysis
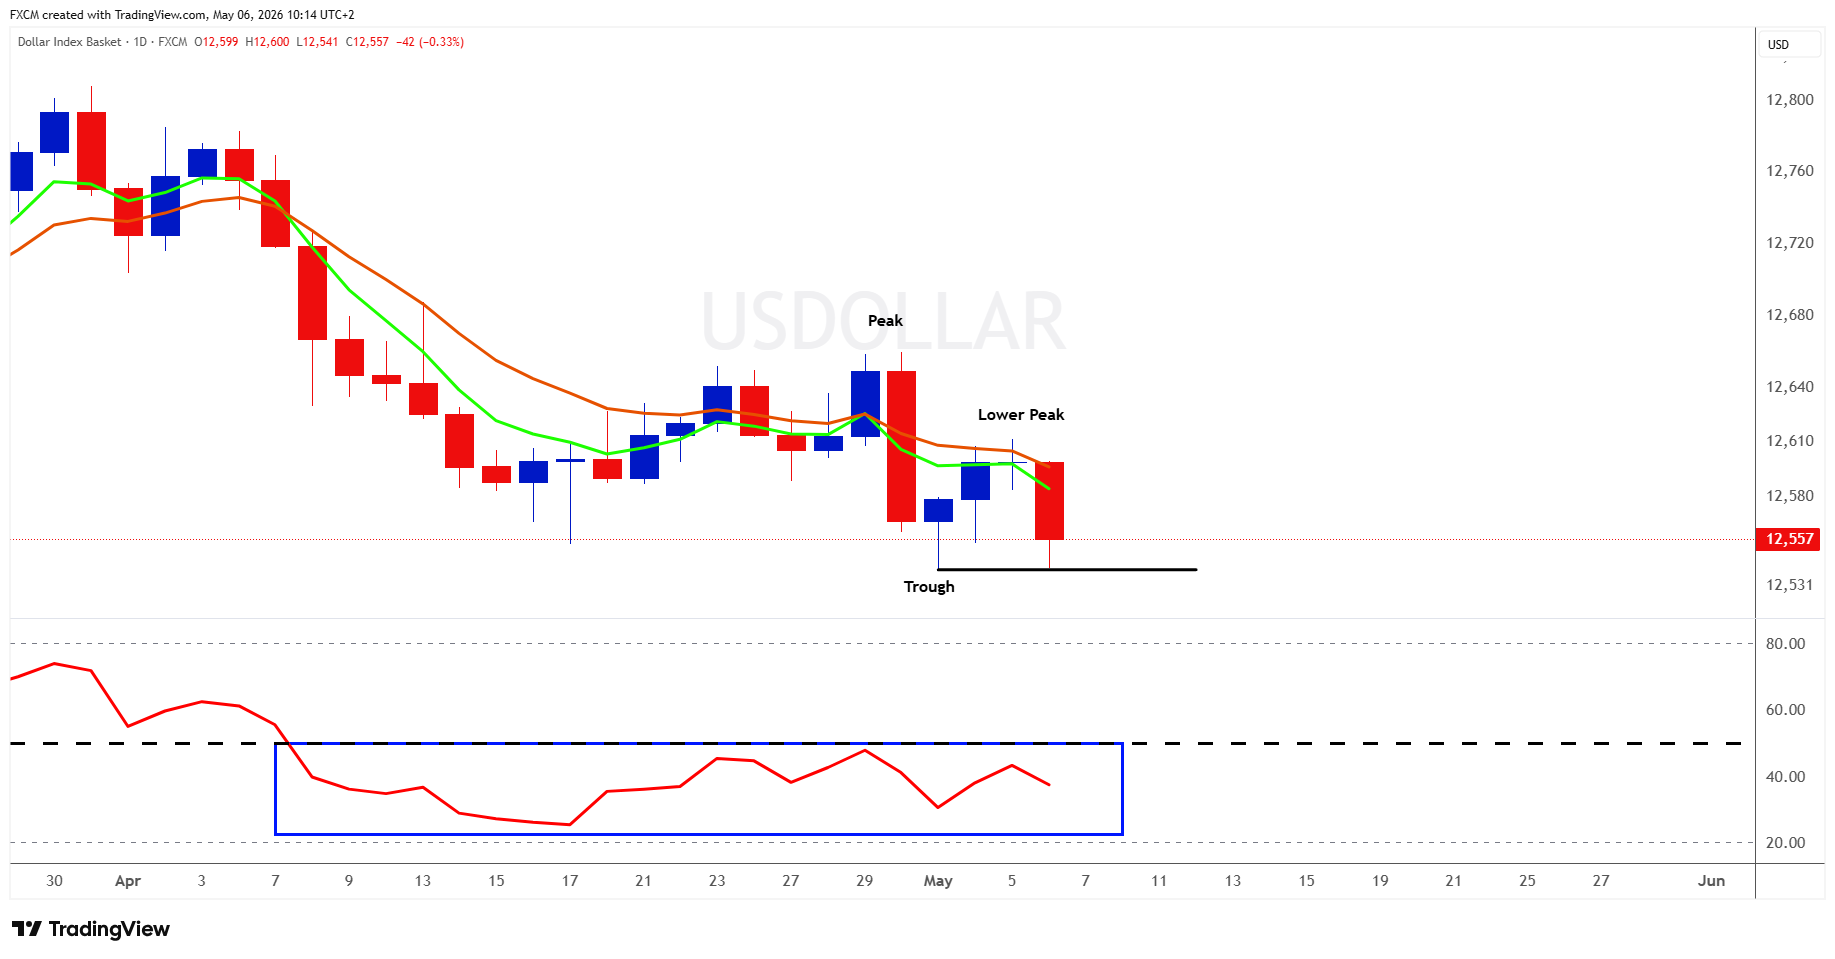
Although the EMAs are bearishly aligned with clear slope and separation, this leg of the USDOLLAR move has yet to confirm a trend. A lower peak is in place, but a lower trough is still needed. If that forms, the daily chart will shift into a confirmed downtrend.
The RSI is holding below 50, keeping momentum skewed to the downside. As long as that bias persists, the probability favours a lower trough forming and the greenback entering its next bearish phase.
Fundamental Perspective
For now, the Federal Reserve remains cautious, with inflation risks still elevated, partly due to the rise in oil prices linked to the conflict. That has kept rate cut expectations limited and even left the door open to tighter policy if inflation proves sticky, helping to underpin the dollar.
However, oil prices have started to ease on renewed optimism around US–Iran peace talks and a partial de-escalation in tensions. As a result, inflation pressures are softening at the margin, which has weighed on the dollar.
This is where the RSI holding below 50 becomes important. It signals a market already leaning toward a weaker dollar narrative, driven by expectations that easing geopolitical risk and stabilising energy prices will eventually allow the Fed to step back from its cautious stance. The key is whether this dynamic holds. A renewed escalation would likely push oil higher again, reignite inflation concerns, and provide fresh support for the greenback.
Some Currencies to Keep an Eye On
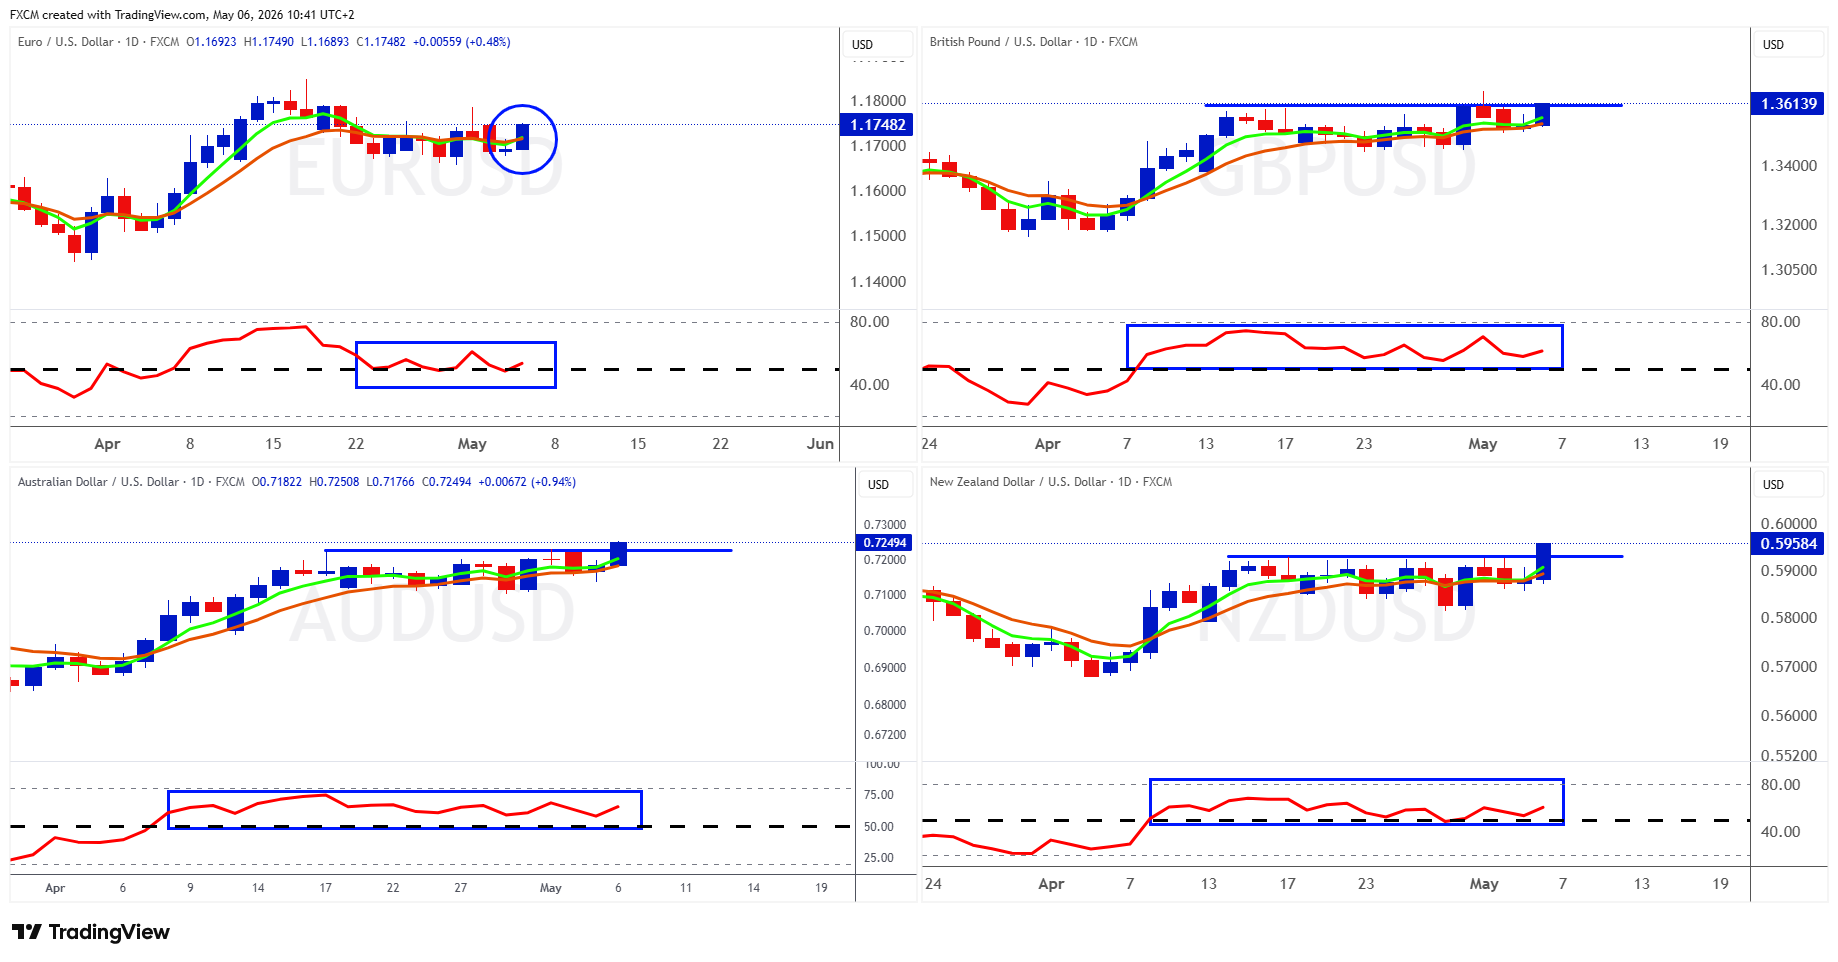
Here we have EURUSD (top left), GBPUSD (top right), AUDUSD (bottom left) and NZDUSD (bottom right).
All four pairs will be heavily influenced by how the USDOLLAR chart unfolds, but they are showing constructive setups nonetheless. EURUSD is the least convincing at this stage, with EMAs only just turning higher and RSI still needing to hold above 50 to build sustained bullish momentum.
GBPUSD is testing resistance around 1.3610. However, with RSI holding above 50, the bias remains to the upside and a break higher looks plausible if that momentum persists.
The antipodeans look the most constructive. Both AUDUSD and NZDUSD have broken above their respective resistance levels, supported by the Reserve Bank of Australia raising its cash rate by 25 basis points to 4.35%. As long as RSI in both pairs holds above 50, the case for further upside remains intact.
Gold
Technical Analysis
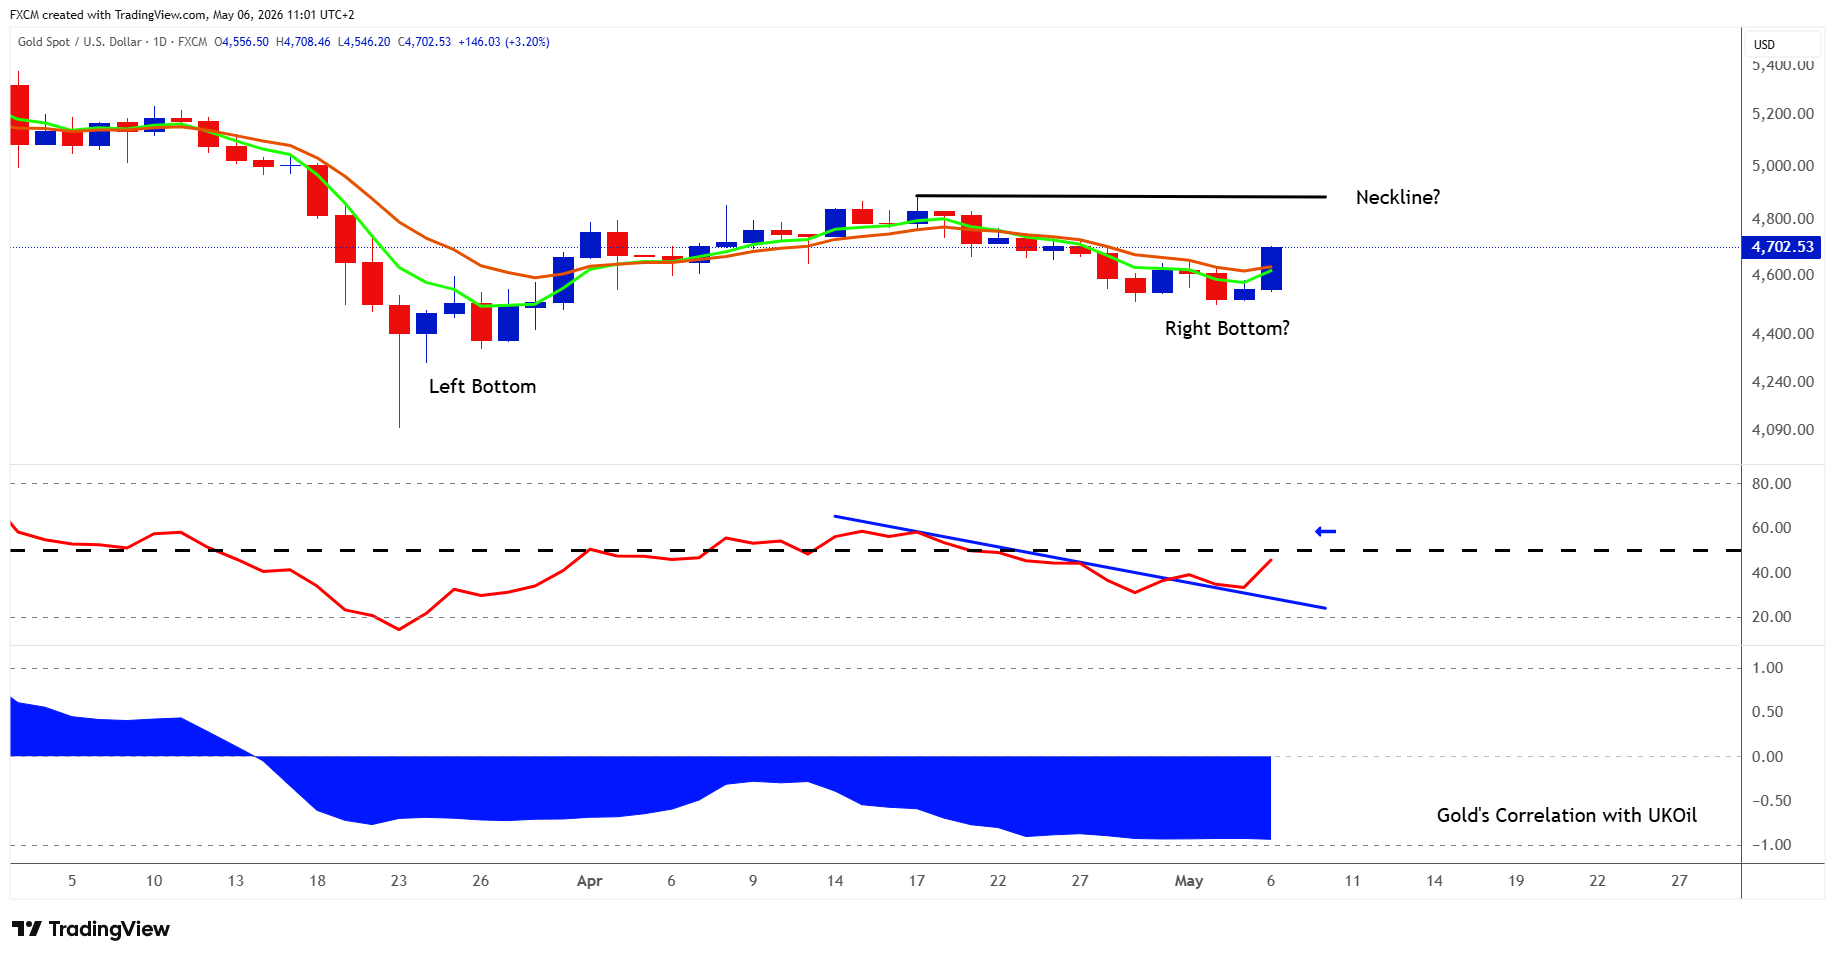
Gold shows a strong negative correlation of around -95% with UKOil, meaning the two are moving closely but in opposite directions. With UKOil appearing to form a potential double top, it is not surprising that gold is showing a near mirror image, with signs of a possible double bottom.
That said, this view remains premature. As with UKOil, gold would need to break above its neckline to confirm the pattern.
On the momentum side, gold's RSI has broken a downsloping trendline, suggesting downside pressure is easing. However, it still needs to move above 50 and hold there for positive momentum to take hold and support a confirmed double bottom.
Fundamental Perspective
While correlation does not imply causation, the prospect of progress in peace talks does seem to be a key driver for gold. If tensions ease, oil prices should decline as the Strait of Hormuz reopens, reducing inflationary pressure.
That, in turn, would give the Fed more room to shift in a looser direction. Yields would likely fall, the dollar would soften, and gold would benefit as the relative appeal of yield-bearing safe-haven assets diminishes.
Again, if talks fail and the conflict escalates, this analysis will need to be reassessed.
Index in Focus: JPN225
Technical Analysis
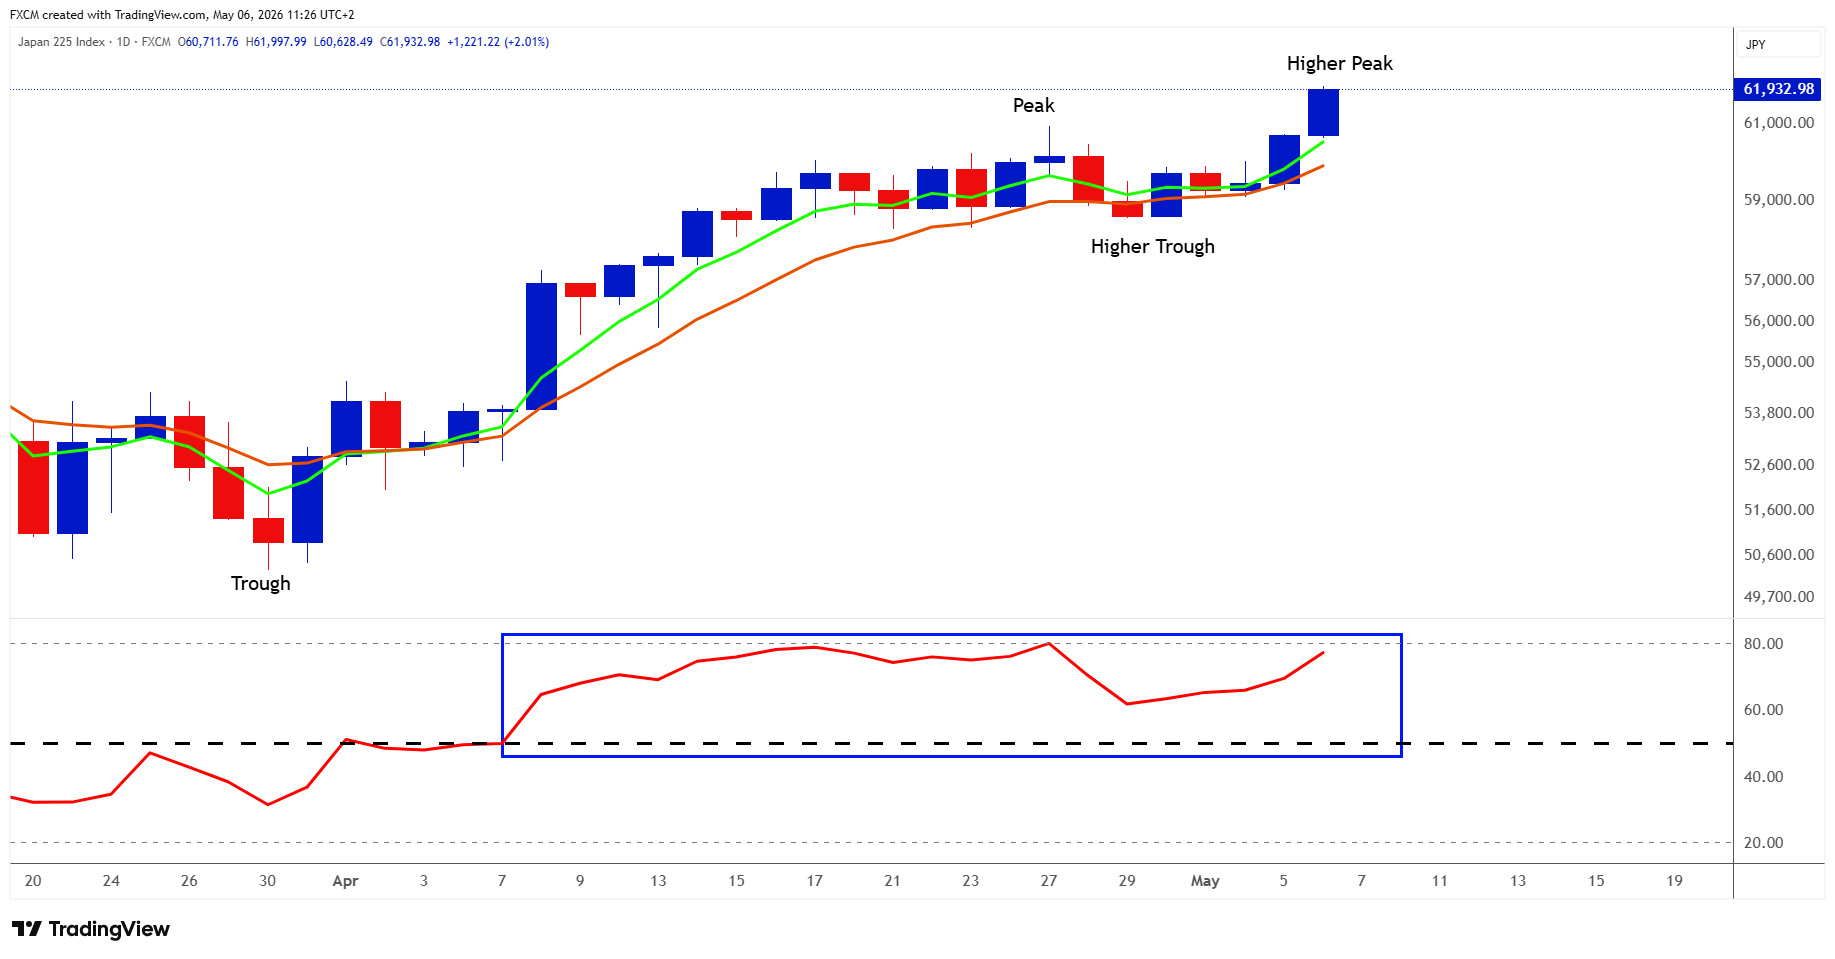
We last looked at JPN225 in the 15 April edition of Market Threads, when it was trading at 58,286. Since then, it has gained over 6% and is now trading around 62,070.
The EMAs remain constructive, and the index has formed a higher trough followed by a higher peak, confirming a daily uptrend. Its RSI has held above 50 since early April, pointing to sustained bullish momentum.
As long as RSI remains above 50, the path of least resistance is to the upside. That said, the indicator is approaching 80, and while it is not there yet, a move into overbought territory is getting closer. Even so, given the strength of the trend and momentum, any pullbacks from overbought levels are likely to be well supported and could offer opportunities for the next leg higher
Fundamental Perspective
The bullish case for JPN225 is driven by structural reform, improving macro conditions, and supportive capital flows rather than short-term geopolitical developments. Japanese companies are becoming more efficient with capital, increasing shareholder returns, and delivering stronger profitability, all of which support the market's re-rating. At the same time, the economy has moved out of deflation into a more stable inflation environment of around 2%, allowing earnings growth in a way not seen for decades.
Foreign investor interest remains strong but is not yet fully exhausted, leaving scope for further inflows, with expectations still pointing to medium-term upside. While the Iran conflict has weighed on sentiment through higher energy costs, particularly given Japan's reliance on imported oil, this is a cyclical headwind rather than a structural shift. Progress in peace talks, reduced risk around the Strait of Hormuz, and lower oil prices would act as additional tailwinds for the index.
Russell Shor
Senior Market Strategist
Russell Shor is a Senior Market Strategist at FXCM, having been promoted to the role in 2025 in recognition of his depth of insight and consistent delivery of high-impact market analysis. He originally joined FXCM in October 2017 as a Senior Market Specialist.
Russell holds an Honours Degree in Economics from the University of South Africa, is a certified FMVA®, and a full member of the Society of Technical Analysts (UK). With over 20 years of experience in financial markets, his work is renowned for its clarity, precision, and strategic value across asset classes.
Any opinions, news, research, analyses, prices, other information, or links to third-party sites contained on this website are provided on an "as-is" basis, as general market commentary and do not constitute investment advice. The market commentary has not been prepared in accordance with legal requirements designed to promote the independence of investment research, and it is therefore not subject to any prohibition on dealing ahead of dissemination. Although this commentary is not produced by an independent source, FXCM takes all sufficient steps to eliminate or prevent any conflicts of interests arising out of the production and dissemination of this communication. The employees of FXCM commit to acting in the clients' best interests and represent their views without misleading, deceiving, or otherwise impairing the clients' ability to make informed investment decisions. For more information about the FXCM's internal organizational and administrative arrangements for the prevention of conflicts, please refer to the Firms' Managing Conflicts Policy. Please ensure that you read and understand our Full Disclaimer and Liability provision concerning the foregoing Information, which can be accessed here.