AUD/USD Helped by China’s Data
Australia's largest trade partner, China [1], released improved Retail Sales and industrial Production for the month of October, providing a boost to the Aussie and to overall market sentiment.
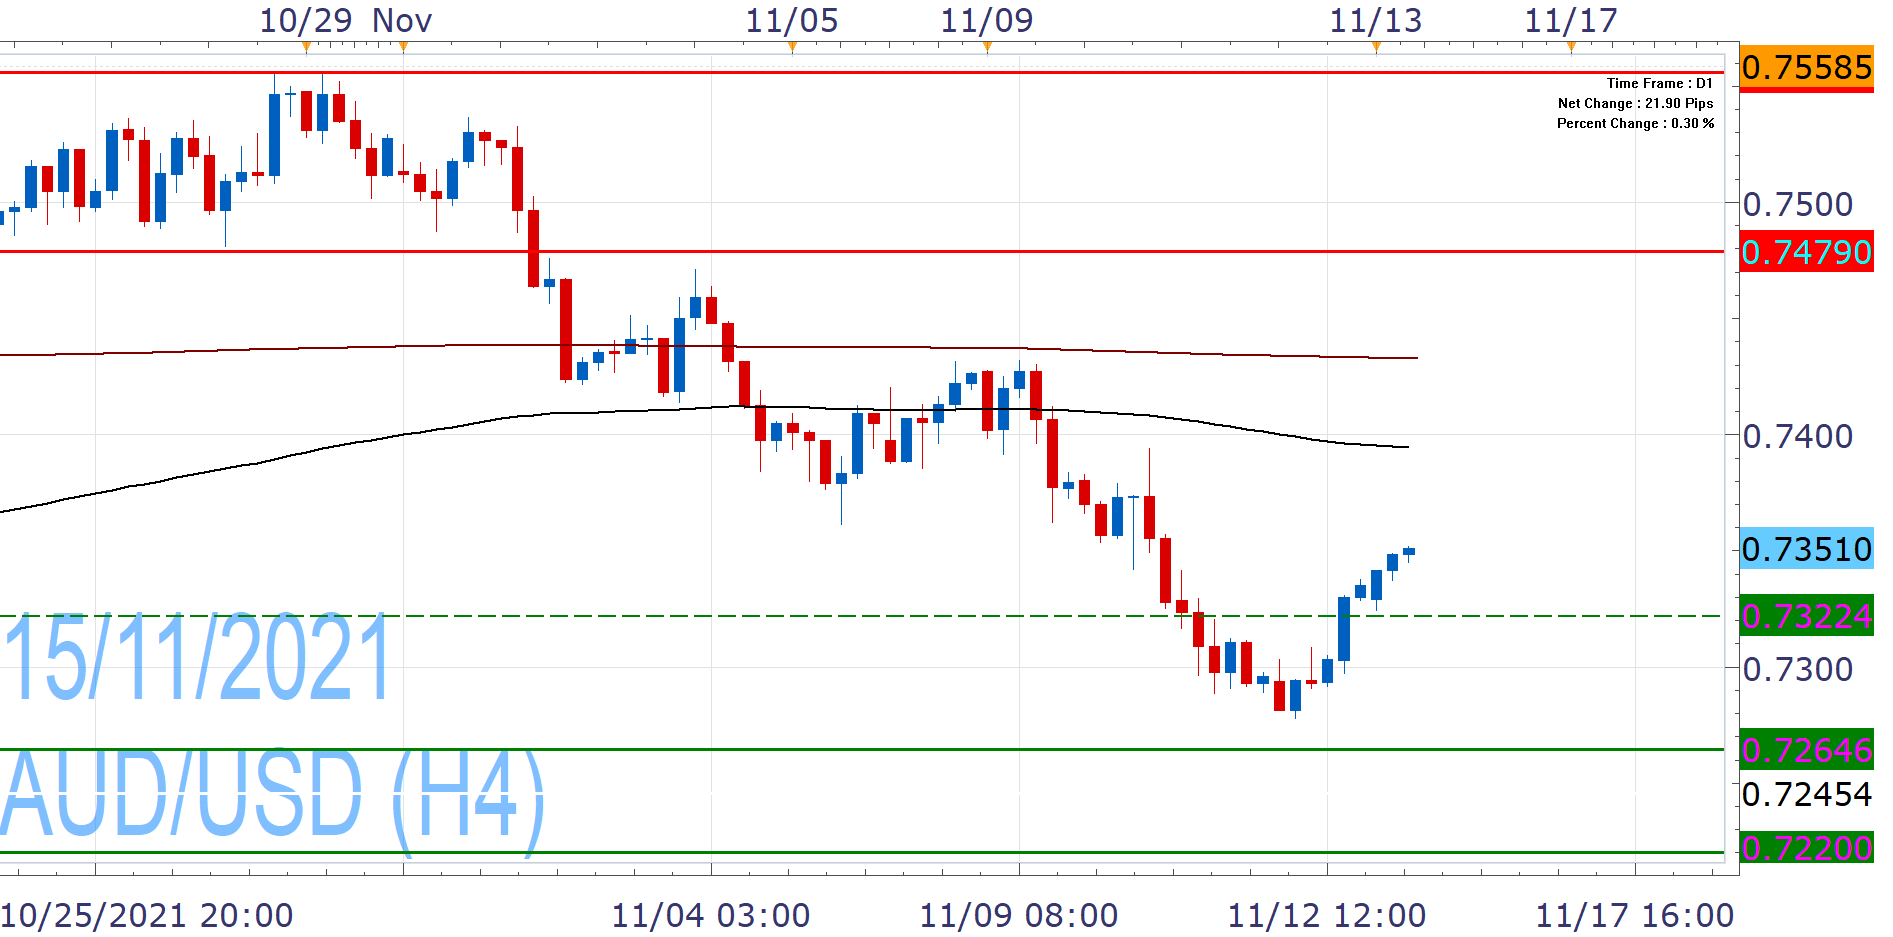
As such, it extends Friday's rebound past 0.7341, which marks the 23.6% Fibonacci of the October High/November low drop. This can lead to a larger correction towards the 38.2% Fibonacci but this area poses a strong resistance as EMA200 sits just a little higher (0.7382-95). Sustained risk on mood and/or positive catalyst will be need for further gains.
Despite today's upbeat sentiment, AUD/USD had taken a double hit last week from increased Australian Unemployment and hot US Inflation, while central bank divergence remains unfavorable.
Current levels may spark fresh selling pressure and knock it back below 0.7322-17, which will keep the risk for new month low on (0.7275-64).
Amidst lack of catalysts, the pair's trajectory will likely be determined by broader investor sentiment, but on Tuesday, we expect RBA's minutes and speech by its governor.
Past Performance: Past Performance is not an indicator of future results.
Nikos Tzabouras
Senior Financial Editorial Writer
Nikos Tzabouras is a graduate of the Department of International & European Economic Studies at the Athens University of Economics and Business. With extensive experience in market analysis and a strong foundation in international relations, he brings a unique perspective to financial markets. Nikos emphasizes not only technical analysis but also on fundamentals and the growing influence of geopolitics on financial trends.
As a Senior Financial Editorial Writer, he delivers comprehensive and forward-looking insights across a wide range of asset classes, including equities, commodities, and currencies. His work explores how macroeconomic events, political developments, and global policies impact market dynamics, providing readers with a deeper understanding of both short-term movements and long-term trends.
References
| Retrieved 15 Nov 2021 https://www.dfat.gov.au/publications/trade-and-investment/trade-and-investment-glance-2020 |
Any opinions, news, research, analyses, prices, other information, or links to third-party sites contained on this website are provided on an "as-is" basis, as general market commentary and do not constitute investment advice. The market commentary has not been prepared in accordance with legal requirements designed to promote the independence of investment research, and it is therefore not subject to any prohibition on dealing ahead of dissemination. Although this commentary is not produced by an independent source, FXCM takes all sufficient steps to eliminate or prevent any conflicts of interests arising out of the production and dissemination of this communication. The employees of FXCM commit to acting in the clients' best interests and represent their views without misleading, deceiving, or otherwise impairing the clients' ability to make informed investment decisions. For more information about the FXCM's internal organizational and administrative arrangements for the prevention of conflicts, please refer to the Firms' Managing Conflicts Policy. Please ensure that you read and understand our Full Disclaimer and Liability provision concerning the foregoing Information, which can be accessed here.