
UKOil Declines as Geopolitical Premium Unwinds, but the Uptrend Is Not Yet Broken


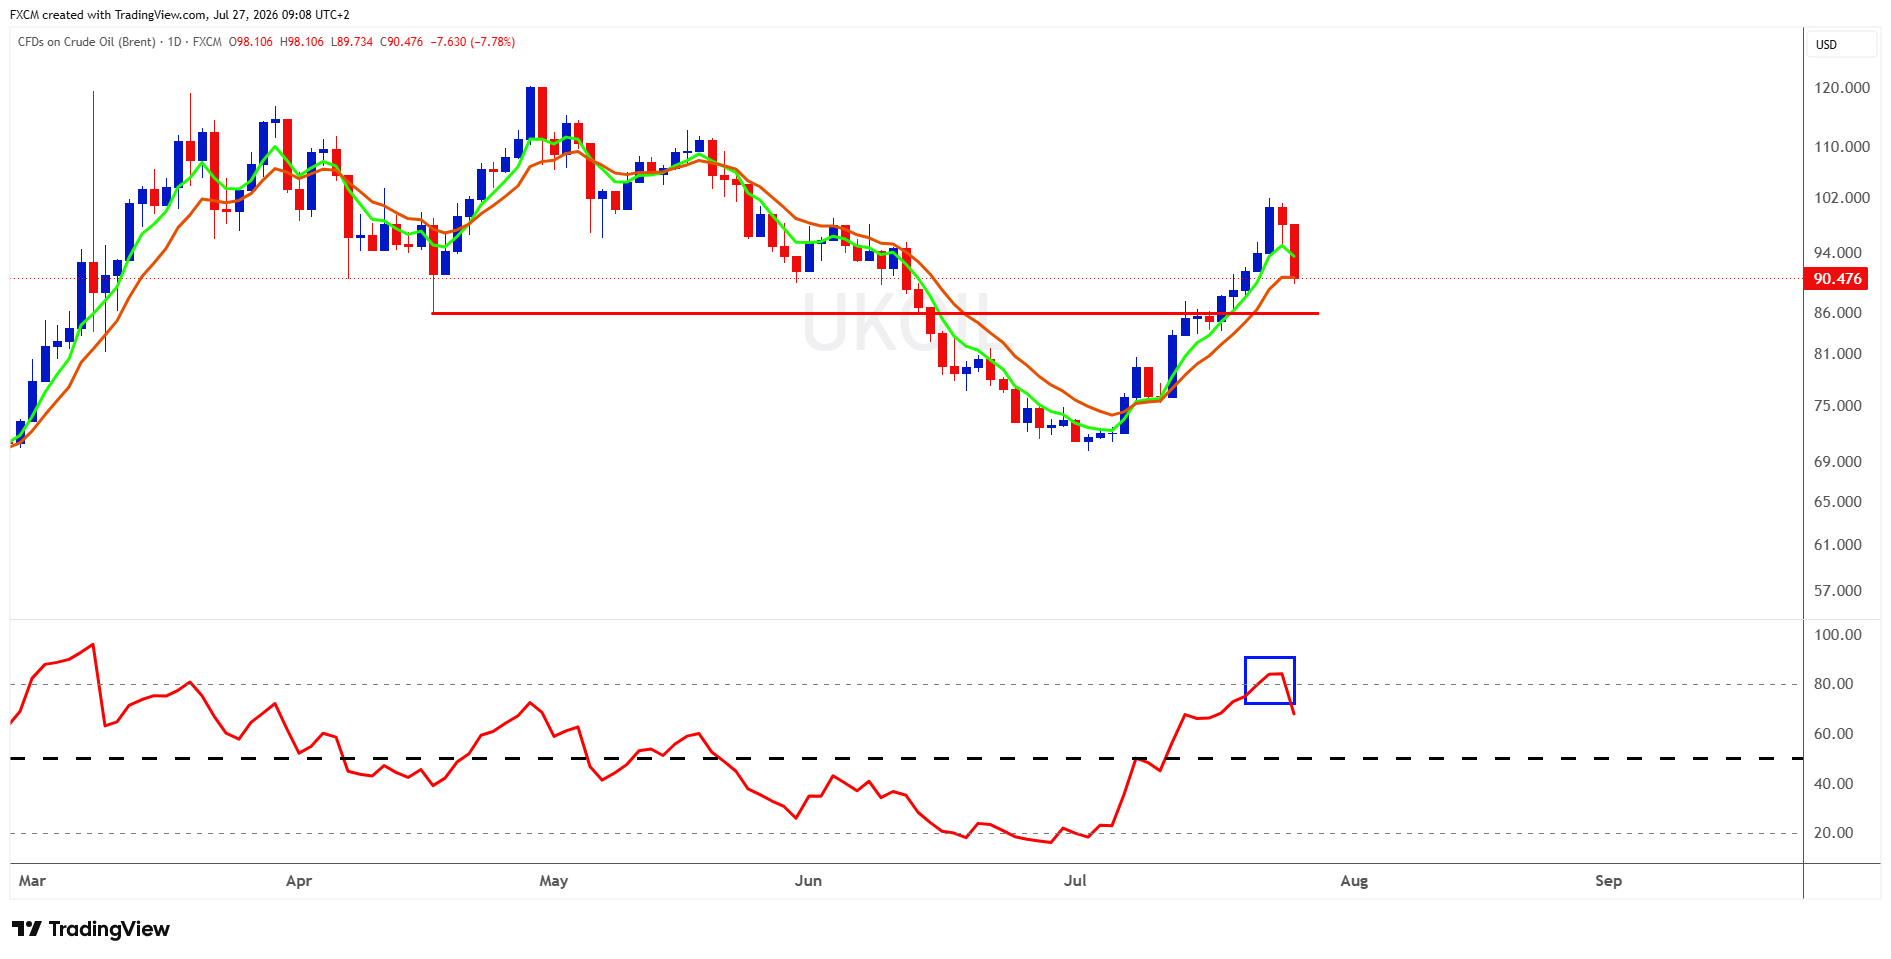
UKOil's powerful July rally has run into its first serious obstacle. FXCM's Brent crude CFD fell almost 8% in the latest session, sliding from an opening level near $98.11 to around $90 after briefly touching $89.73.
The trigger was a reported pause in US and Iranian attacks. That has not removed the geopolitical threat, but it has reduced the immediate fear of a further disruption to Middle Eastern oil supplies. After several weeks in which traders were prepared to pay almost any price for protection against escalation, part of that risk premium is now being handed back.
Technically, the reversal is dramatic but not entirely surprising. Brent had climbed from roughly $71 in early July to just above $100, a gain of more than 40% in a matter of weeks. The move was fast, emotional and increasingly stretched. Once prices approached the psychologically important $100 level, even a modest improvement in the news flow was enough to tempt traders to lock in profits.
Momentum had also been flashing a warning. The relative strength index rose above 80 during the final leg of the advance, placing the market deep in overbought territory. It has since retreated towards the upper 60s. That does not automatically signal the start of a reversal, but it does show that the almost one-way buying pressure has broken.
The latest candle has pushed Brent below the faster green moving average and back towards the slower orange average near $90. That leaves the market at an awkward point. The short-term trend has clearly been damaged, but the broader recovery from the July low has not yet been decisively reversed.
The key area is $85-$86. This region supported prices during April, gave way during the June decline and then acted as resistance as UKOil recovered. The subsequent breakout above it turned the zone into potential support once again.
Holding above $85-$86 would keep the broader recovery alive and could allow UKOil to settle into a range between approximately $86 and $94. That would give momentum time to cool without destroying the bullish structure.
A daily close below $85 would be more concerning. It would suggest that the recent breakout has failed and could open the way towards $80-$81, followed by the former consolidation area around $75-$76.
On the upside, Brent first needs to regain $94 to steady the chart. A recovery through $98 and then the $100-$102 region would be required before buyers could convincingly claim control again.
The retreat in oil has also brought some relief to wider markets. Lower energy prices ease near-term inflation concerns, help support government bonds and reduce the pressure on the Federal Reserve to tighten policy immediately. That backdrop has contributed to stronger equities, lower Treasury yields and a softer dollar.
For now, this looks less like the end of the oil story than a reality check after an overheated rally. The next decisive move will depend on whether $85-$86 attracts buyers, or finally gives way.

Russell Shor
Senior Market Strategist
Russell Shor is a Senior Market Strategist at FXCM, having been promoted to the role in 2025 in recognition of his depth of insight and consistent delivery of high-impact market analysis. He originally joined FXCM in October 2017 as a Senior Market Specialist.
Russell holds an Honours Degree in Economics from the University of South Africa, is a certified FMVA®, and a full member of the Society of Technical Analysts (UK). With over 20 years of experience in financial markets, his work is renowned for its clarity, precision, and strategic value across asset classes.


Any opinions, news, research, analyses, prices, other information, or links to third-party sites contained on this website are provided on an "as-is" basis, as general market commentary and do not constitute investment advice. The market commentary has not been prepared in accordance with legal requirements designed to promote the independence of investment research, and it is therefore not subject to any prohibition on dealing ahead of dissemination. Although this commentary is not produced by an independent source, FXCM takes all sufficient steps to eliminate or prevent any conflicts of interests arising out of the production and dissemination of this communication. The employees of FXCM commit to acting in the clients' best interests and represent their views without misleading, deceiving, or otherwise impairing the clients' ability to make informed investment decisions. For more information about the FXCM's internal organizational and administrative arrangements for the prevention of conflicts, please refer to the Firms' Managing Conflicts Policy. Please ensure that you read and understand our Full Disclaimer and Liability provision concerning the foregoing Information, which can be accessed here.