
NVIDIA’s Bullish Wedge Breakout Signals the Dip May Be Over


Technical Analysis
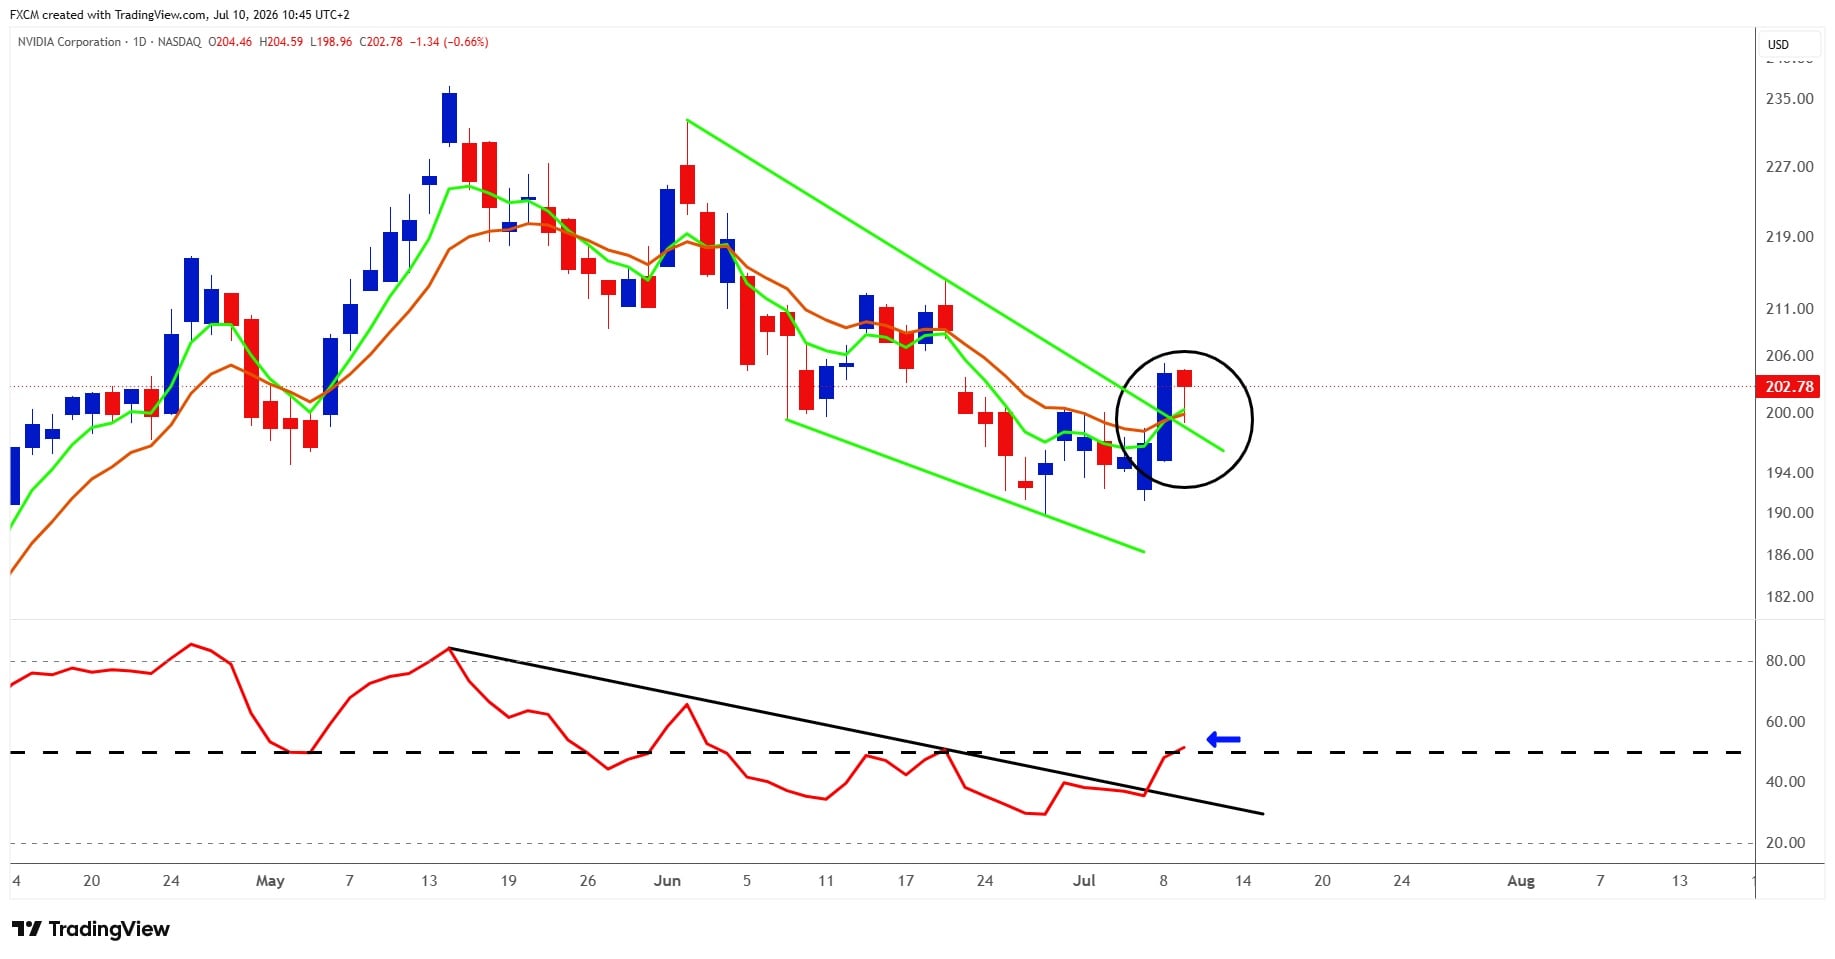
NVIDIA has staged a technically constructive breakout from the falling wedge that had contained the shares since early June. Price has pushed through the wedge's upper boundary near $199-$200 and moved back above both short-term moving averages, suggesting that selling pressure is beginning to ease and that momentum may be turning in favour of buyers.
The momentum signal is particularly encouraging. RSI has broken above its own descending trendline and moved back above the neutral 50 level. This provides confirmation that the price breakout is being accompanied by improving underlying momentum rather than representing an isolated price spike. The combination of a falling-wedge breakout and an RSI move above 50 strengthens the bullish reversal case.
The immediate test is the $204-$206 region, where the latest advance has encountered resistance. A decisive daily close above this area would provide stronger confirmation and could open the way towards approximately $211, followed by the more significant $218–$220 zone.
On the downside, the former wedge resistance around $199-$200 should now act as initial support. A controlled pullback that holds this area would represent a constructive retest of the breakout. A move back below $198 would weaken the signal, while a break below roughly $193-$194 would raise the risk that the breakout has failed.
Overall, the chart has shifted from a persistent short-term decline towards an emerging bullish reversal.
China Reopening Hopes Add Fundamental Weight to NVIDIA's Breakout
A potentially supportive fundamental catalyst is the prospect of NVIDIA gaining limited access to China's advanced-AI-chip market. The US has reportedly cleared about ten Chinese companies to buy H200 processors, while Beijing is considering whether to permit restricted imports, although no final approval has been announced and NVIDIA has so far recorded no revenue under the programme.
Even a modest reopening could provide incremental sales and improve sentiment towards a business that remains underpinned by exceptional AI-infrastructure demand: NVIDIA's fiscal first-quarter revenue reached a record $81.6 billion, including $75.2 billion from Data Centre.
The technical breakout therefore coincides with a credible fundamental catalyst, but the China opportunity remains speculative, while export controls, domestic Chinese competition and mounting scrutiny of hyperscaler returns remain important risks.

Russell Shor
Senior Market Strategist
Russell Shor is a Senior Market Strategist at FXCM, having been promoted to the role in 2025 in recognition of his depth of insight and consistent delivery of high-impact market analysis. He originally joined FXCM in October 2017 as a Senior Market Specialist.
Russell holds an Honours Degree in Economics from the University of South Africa, is a certified FMVA®, and a full member of the Society of Technical Analysts (UK). With over 20 years of experience in financial markets, his work is renowned for its clarity, precision, and strategic value across asset classes.


Any opinions, news, research, analyses, prices, other information, or links to third-party sites contained on this website are provided on an "as-is" basis, as general market commentary and do not constitute investment advice. The market commentary has not been prepared in accordance with legal requirements designed to promote the independence of investment research, and it is therefore not subject to any prohibition on dealing ahead of dissemination. Although this commentary is not produced by an independent source, FXCM takes all sufficient steps to eliminate or prevent any conflicts of interests arising out of the production and dissemination of this communication. The employees of FXCM commit to acting in the clients' best interests and represent their views without misleading, deceiving, or otherwise impairing the clients' ability to make informed investment decisions. For more information about the FXCM's internal organizational and administrative arrangements for the prevention of conflicts, please refer to the Firms' Managing Conflicts Policy. Please ensure that you read and understand our Full Disclaimer and Liability provision concerning the foregoing Information, which can be accessed here.