More Pressure on USD/JPY As NA Traders Enter
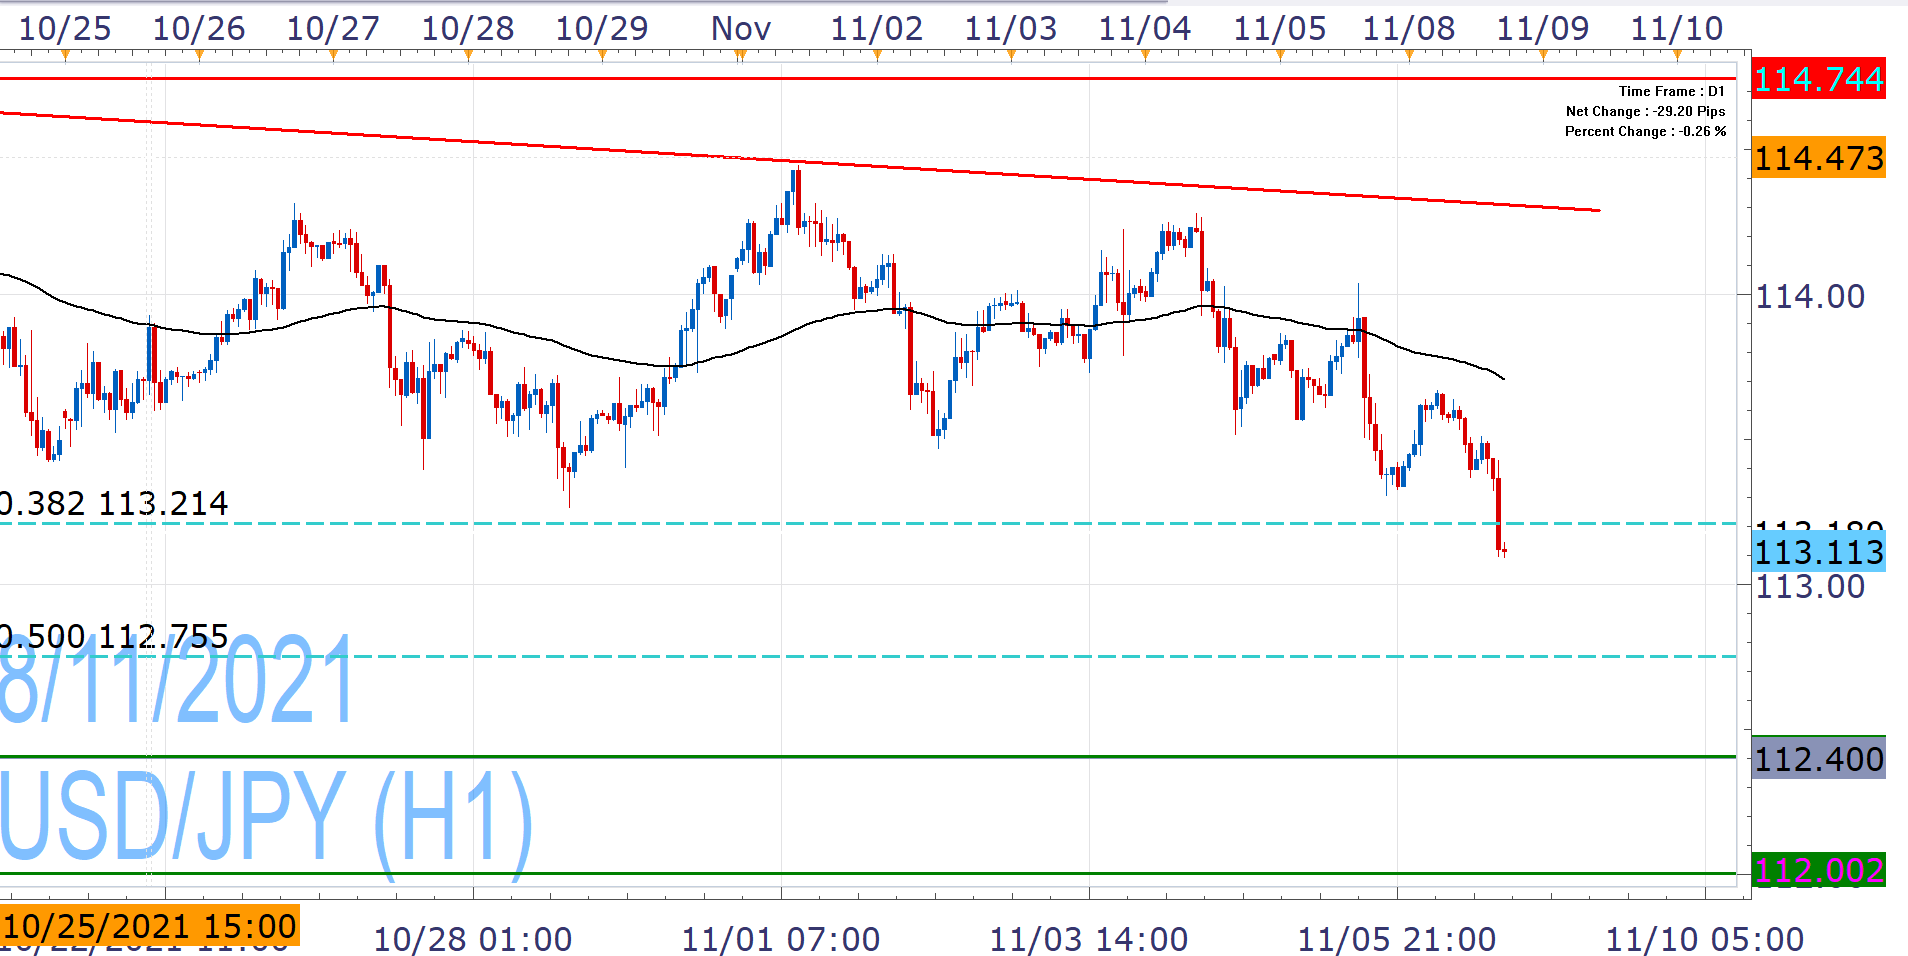
USD/JPY - H1
The pair started the week on the back foot and as the US markets open, it faces more selling pressure and deepens its correction, after the multiyear highs of October.
With multiple lower highs and lower lows in November and just one profitable day, optics are not good, as it breaches the 38.2% Fibonacci of its October low/high rise (113.20). This brings 112.40-23 in to the spotlight, but JPY does not seem ready to threaten it and daily close beyond 113.20 would be needed to pause the broader uptrend.
USD/JPY tries to hold 113.00 and current levels have the ability to provide support, as the RSI moves to oversold territory. This can lead to a recovery effort, but rising back above the EMA100 (110.70-80) appears to be a tall order under the these conditions, while the downward trend line form October highs (at around 114.30) is far into the background.
Past Performance: Past Performance is not an indicator of future results.
Nikos Tzabouras
Senior Financial Editorial Writer
Nikos Tzabouras is a graduate of the Department of International & European Economic Studies at the Athens University of Economics and Business. With extensive experience in market analysis and a strong foundation in international relations, he brings a unique perspective to financial markets. Nikos emphasizes not only technical analysis but also on fundamentals and the growing influence of geopolitics on financial trends.
As a Senior Financial Editorial Writer, he delivers comprehensive and forward-looking insights across a wide range of asset classes, including equities, commodities, and currencies. His work explores how macroeconomic events, political developments, and global policies impact market dynamics, providing readers with a deeper understanding of both short-term movements and long-term trends.
Any opinions, news, research, analyses, prices, other information, or links to third-party sites contained on this website are provided on an "as-is" basis, as general market commentary and do not constitute investment advice. The market commentary has not been prepared in accordance with legal requirements designed to promote the independence of investment research, and it is therefore not subject to any prohibition on dealing ahead of dissemination. Although this commentary is not produced by an independent source, FXCM takes all sufficient steps to eliminate or prevent any conflicts of interests arising out of the production and dissemination of this communication. The employees of FXCM commit to acting in the clients' best interests and represent their views without misleading, deceiving, or otherwise impairing the clients' ability to make informed investment decisions. For more information about the FXCM's internal organizational and administrative arrangements for the prevention of conflicts, please refer to the Firms' Managing Conflicts Policy. Please ensure that you read and understand our Full Disclaimer and Liability provision concerning the foregoing Information, which can be accessed here.