AlphaTrack: Markets Are Looking Overbought

Thoughtful insights and approachable analysis.
- JPMorgan Chase (JPM.us) is flashing bullish technicals while delivering powerful earnings momentum, with any pullback likely a buying opportunity in a bank built to thrive in volatility.
- Advanced Micro Devices (AMD.us) nears highs with overbought momentum, but a pullback may offer an entry as its $60bn Advanced Micro Devices–Meta AI deal reinforces it as a key alternative to Nvidia ahead of earnings.
- Apple (AAPL.us) looks primed for a breakout, with bullish technical momentum building into resilient earnings driven by iPhone strength and high-margin Services growth
Quick Market Overview
Renewed tension in the Middle East unsettled markets, with stalled shipping through the Strait of Hormuz pushing oil prices higher and weighing on equities, as the Nasdaq Composite ended its winning streak and the S&P 500 and Dow Jones Industrial Average edged lower. Investors are largely looking through the volatility to upcoming data and policy signals, particularly retail sales and central bank developments. Adding to the backdrop, Apple announced a major leadership transition, with longtime CEO Tim Cook set to step down in September and hardware chief John Ternus named as successor.
General Equity Market Health (SPX500)
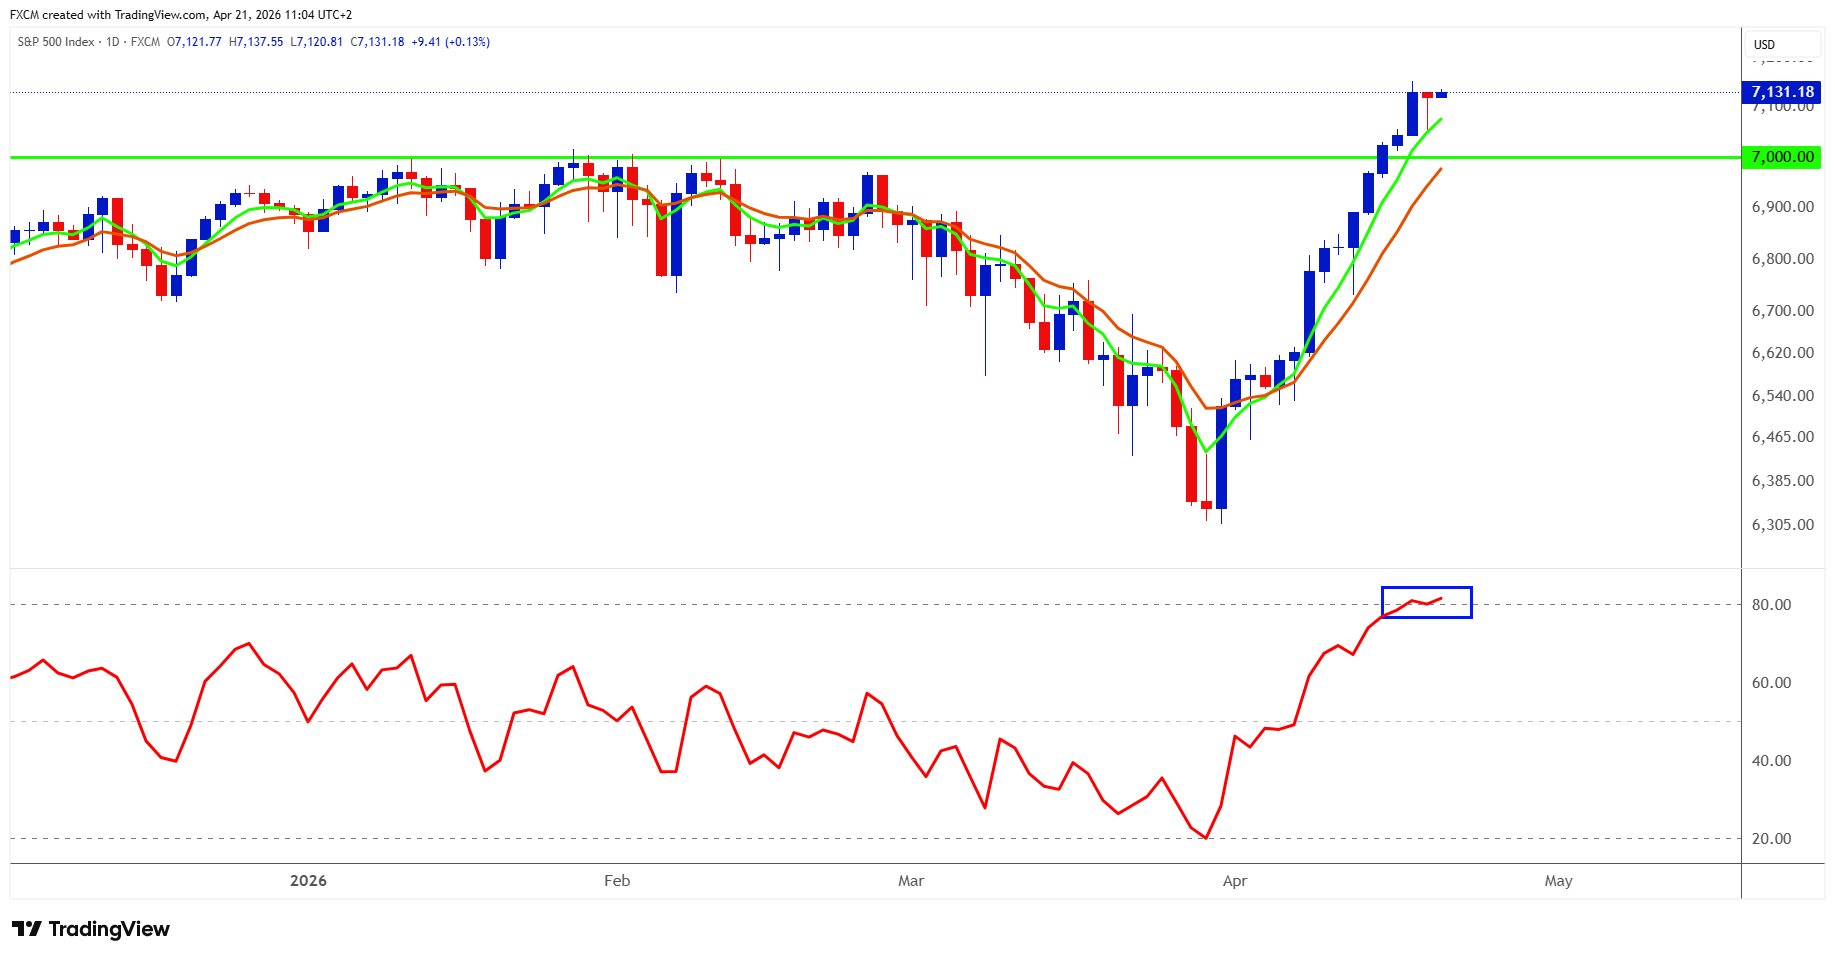
Last week we flagged the psychological 7,000 level as a key milestone. One week on, the SPX500 is trading above 7,100, capping a strong April rally of more than 9%. The pace of the move has pushed RSI above 80, firmly into overbought territory, so a near-term pullback to allow momentum to reset would be unsurprising.
At the same time, the S&P 500 Equal Weighted Index has yet to break its previous high, despite gaining over 6% this month. This points to narrow leadership within the index, with some constituents lagging. A pullback could therefore serve as a healthy reset, allowing broader participation to catch up.
Potential Trade Setups
Caution is warranted given the broader SPX500's overbought position. A couple of weeks ago, AlphaTrack highlighted the FXCM USBANKS basket; this week, we drill down to the individual level and focus on JPM.us. We also revisit AMD.us, first covered in the 24 March edition when it was trading around $202 and now near $275, making it worth another look. Finally, we return to AAPL.us, featured in the 24 February edition at $266; despite some resistance since then, the share is now attempting to push higher once again.
JP Morgan Chase (JPM.us)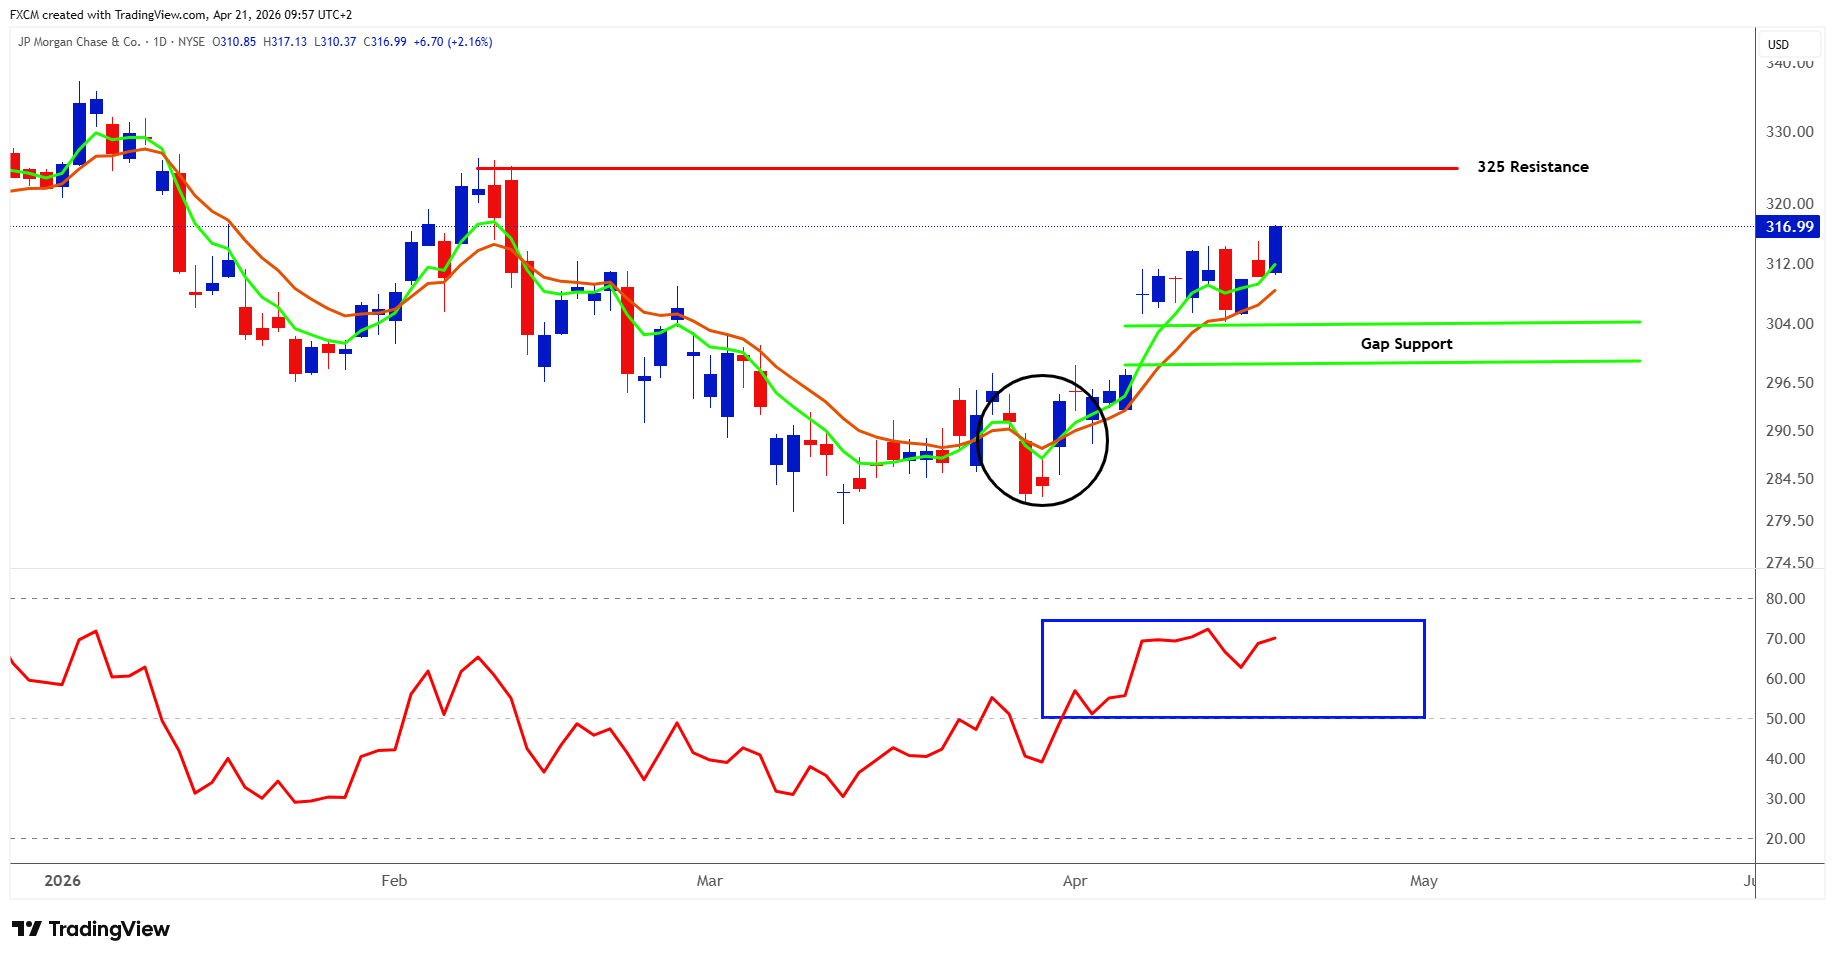
Technical Analysis
- JPM's EMAs remain in a clear bullish formation.
- The share price is nearing overhead resistance around 325.
- With the broader market looking overbought, this level could trigger a pullback.
- That said, JPM still looks attractive, and any weakness is likely to be a dip within a broader uptrend.
- Gap support is a key level to watch in this scenario.
- The RSI needs to hold above 50 (blue rectangle).
- If it does, underlying momentum should remain bullish.
Caveat
- A break below gap support would be a negative signal.
- If the RSI falls below 50 and stays there, the bullish outlook would begin to reverse.
Fundamental Perspective
Last week, JPMorgan reinforced its status as the market's premier bank, delivering a clean Q1 2026 beat with EPS of $5.94 and revenue just under $50bn, powered by surging trading activity, a 28% jump in investment banking fees, and still-solid net interest income. What stands out is the breadth of earnings drivers: markets revenue rose roughly 20% as volatility picked up, while consumer activity remains resilient, giving JPM multiple levers in an uncertain macro environment. Management is clearly cautious on geopolitics and credit, but that arguably strengthens the story, not weakens it. With returns pushing towards 20% and scale advantages across every major banking segment, JPM is not just navigating volatility, it is monetising it, positioning the bank as a structural winner if 2026 remains choppy rather than smoothly rate-driven.
Advanced Micro Devices Inc. (AMD.us)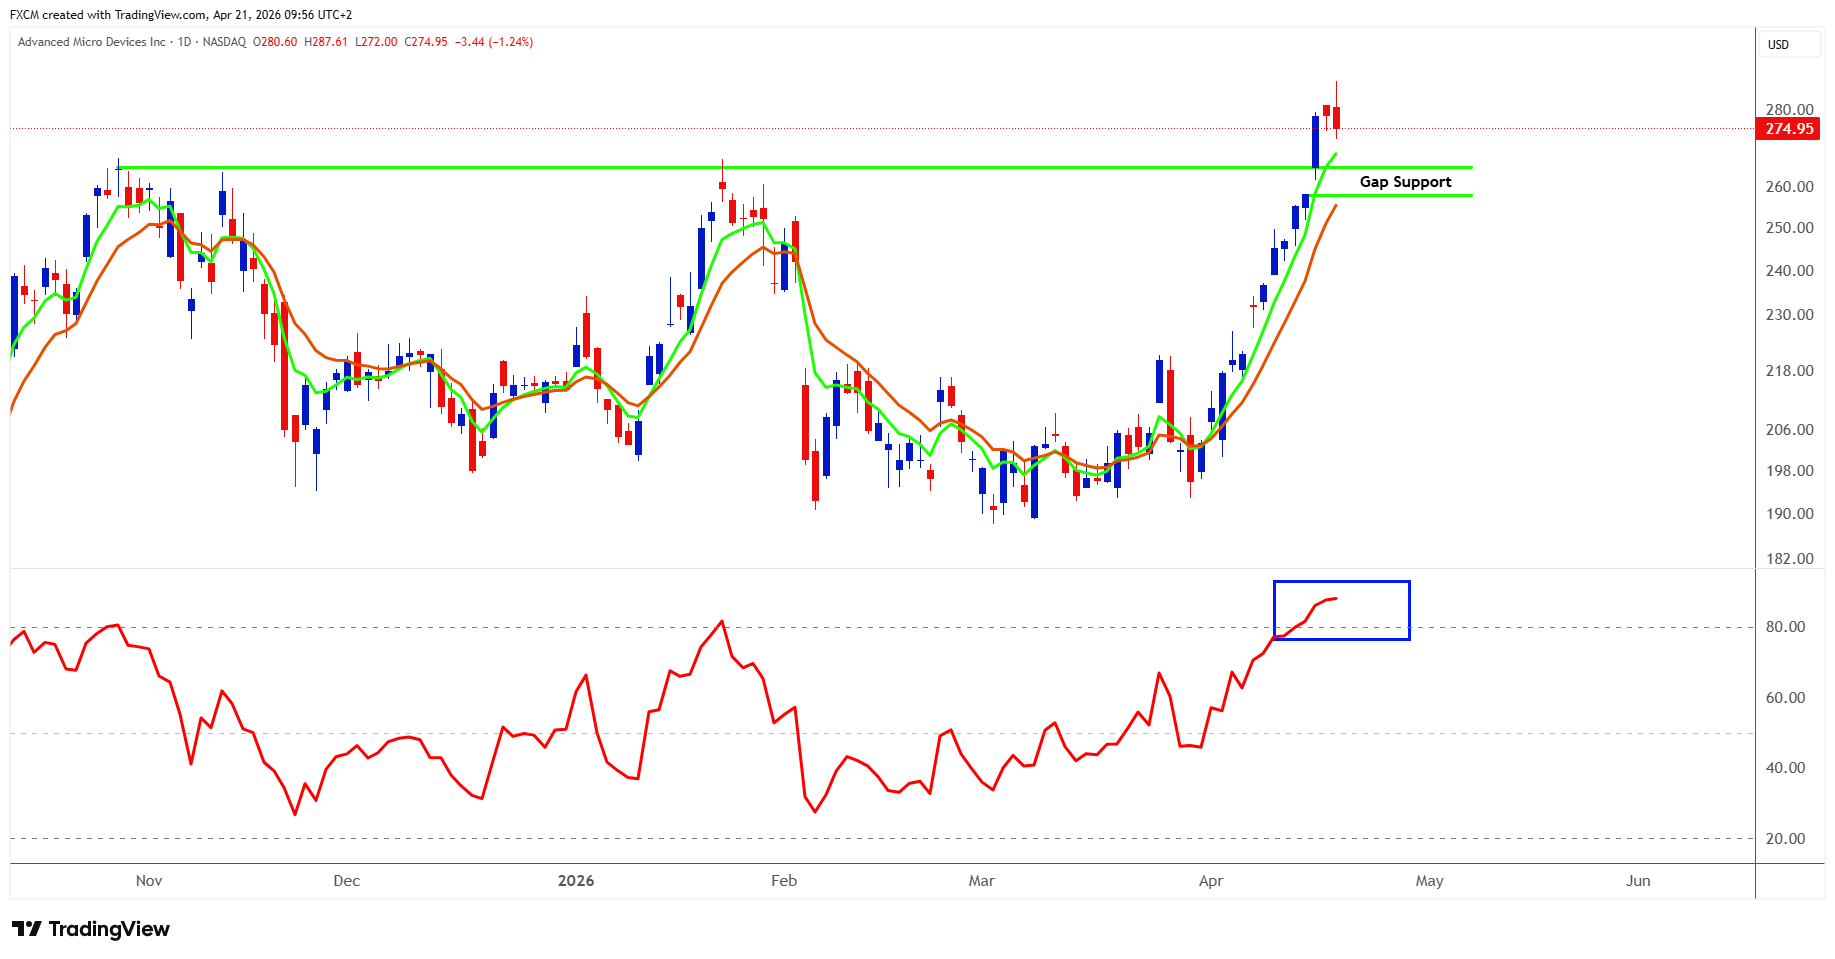
Technical Analysis
- AMD has delivered a strong April, up 35% for the month.
- The stock is now trading close to all-time highs.
- It is therefore not surprising that the RSI (blue rectangle) is signalling overbought conditions.
- A pullback as the RSI cools would be entirely normal.
- Focus should now shift to key support levels.
- A clear area to watch is the gap support between $258 and $265.
- As long as the RSI holds above 50, underlying momentum remains bullish.
- A pullback into support, while the RSI stays above 50, would present a compelling setup.
Caveat
- A break below the gap support would be a mild negative.
- However, if the RSI falls below 50 and holds there, the outlook turns more decisively negative.
Fundamental Perspective
AMD is increasingly positioning itself at the centre of the AI infrastructure buildout, with its multi-year partnership with Meta standing out as a defining validation of its strategy. The deal, which could total up to roughly $60bn over time, involves deploying up to 6 gigawatts of AMD Instinct GPUs across Meta's next-generation AI data centres, with shipments only beginning to scale in the second half of 2026 and tied to performance and deployment milestones rather than upfront revenue recognition.
What matters for investors is not just the size of the agreement, but what it signals: hyperscalers are actively diversifying away from a single-vendor model, and AMD is now firmly embedded as the leading alternative to Nvidia in that shift. It still trails at the very high end of the AI stack, but with data centre demand accelerating and visibility improving through long-dated partnerships, the setup into its 5 May earnings is clear. This is no longer a "what if" story, it is an execution story, where upside comes from how quickly AMD can convert this pipeline into realised revenue in a market that remains supply-constrained but structurally growing.
Apple (AAPL.us)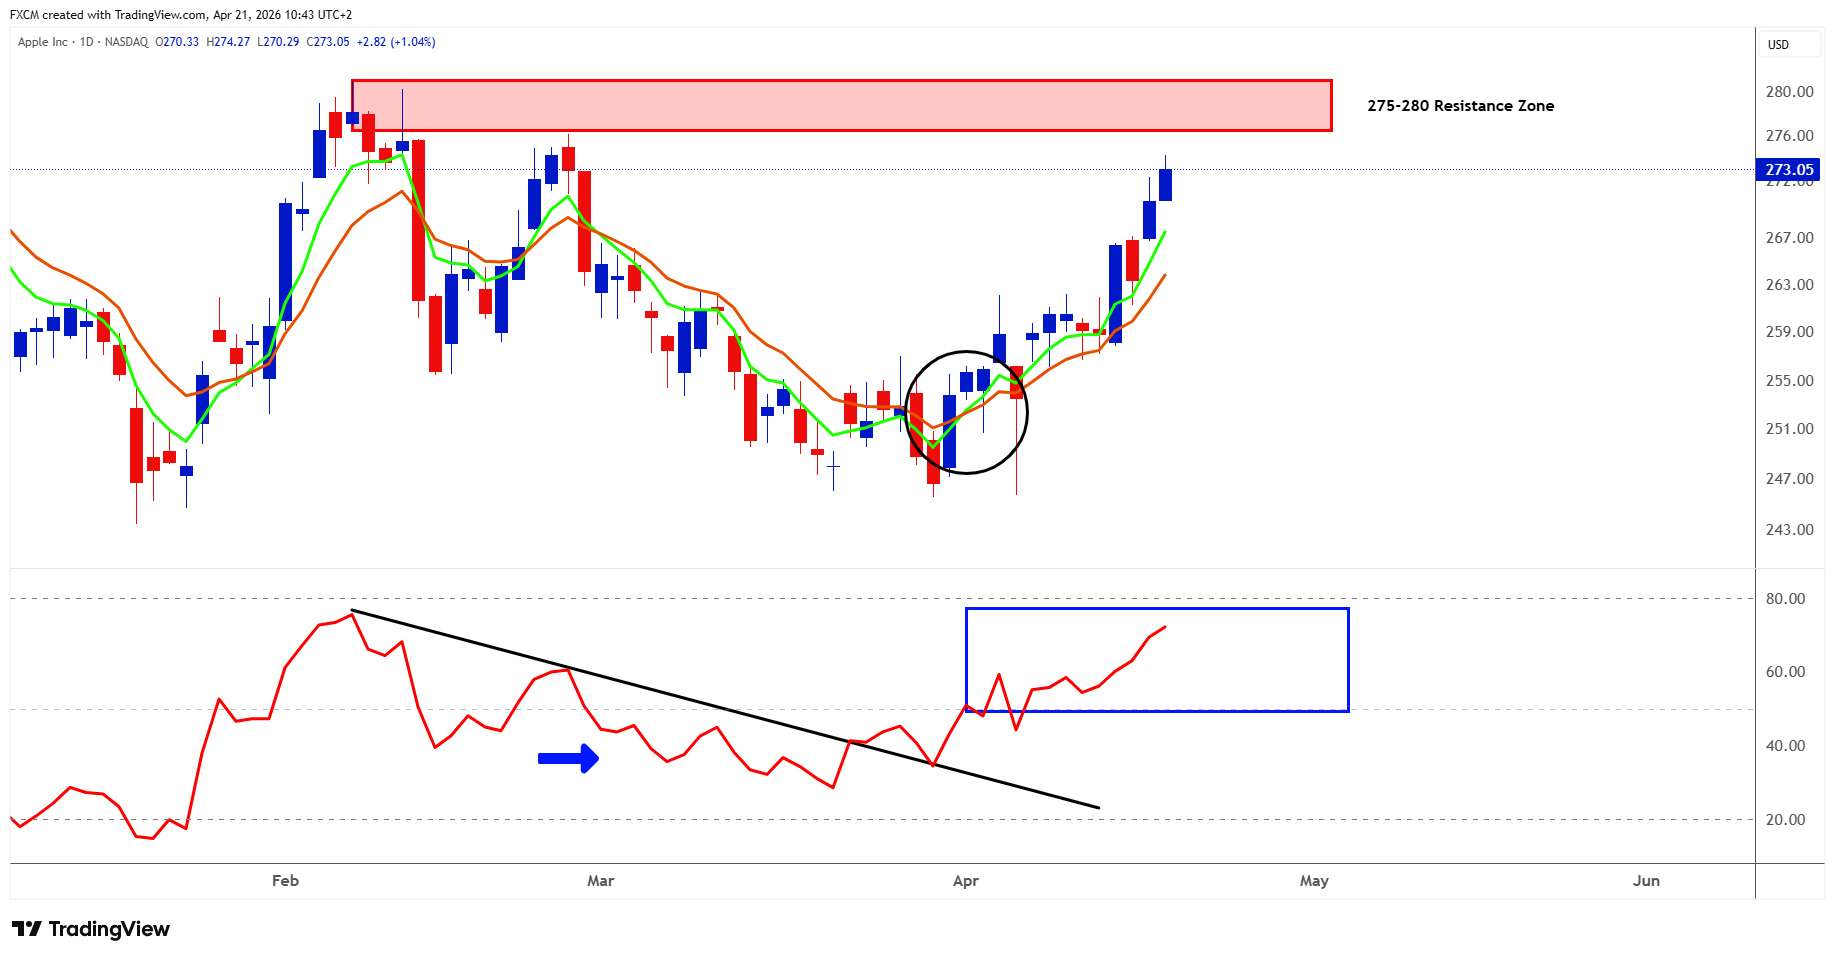
Technical Analysis
- AAPL's EMAs are aligned in a bullish formation.
- The share price is approaching a key resistance zone between 275–280.
- The RSI has broken above its downward-sloping trendline and is now holding above 50 (blue rectangle).
- As long as the RSI remains above 50, momentum is considered positive.
- This setup suggests a potential break above the overhead resistance zone.
Caveat
- If resistance holds, it would weaken the bullish case.
- A sustained move in the RSI below 50, as seen in March (blue arrow), would reinforce resistance.
- That would materially weaken the bullish outlook.
Fundamental Perspective
Apple heads into its 30 April earnings with one of the most dependable fundamental setups in large-cap tech, built on the combination of iPhone strength and a fast-growing, high-margin Services business. The latest quarter showed exactly why that matters, with revenue reaching $143.8bn, up 16% year-on-year, driven by record iPhone sales of roughly $85bn, up over 20%, alongside Services revenue of $30bn, growing at a steady double-digit pace. The key point for investors is durability: Apple's installed base of more than 2.5 billion devices continues to monetise through subscriptions, payments, and ecosystem engagement, creating a recurring revenue stream that smooths cyclicality. There are cost pressures and some regional variability to watch, but recent data suggests iPhone demand remains resilient even in softer markets. Into this print, the story is not about explosive growth, it is about consistency, pricing power, and cash generation, and if Apple delivers another steady quarter, the stock does not need a re-rating to justify upside.
Hot News, Cold Logic
The SPX500 has broken cleanly above 7,000 to fresh all-time highs, extending what has been a powerful April rally. Momentum is clearly stretched in the short term, with overbought signals flashing and positioning looking crowded, so a period of consolidation or a mild pullback would be a natural next step rather than a warning sign in itself.
The more important point, though, is why any pullback happens. Markets have largely been pricing in a benign outcome, leaning on strong earnings and AI-driven optimism, but beneath the surface the rally has been relatively narrow, with gains on the concentrated side. That leaves the index more exposed than it looks at first glance.
If we do see downside, it may not be purely technical. A renewed spike in oil driven by Middle East tensions, disappointment during earnings season, or a shift in sentiment around AI could all turn a routine pause into something more meaningful. Higher energy prices in particular remain a key risk, as they feed into inflation and can delay rate cuts, tightening financial conditions.
So yes, the trend is still higher and the chart looks strong. But this is not a carefree market. It is a market being pulled higher by momentum and optimism, while quietly carrying a set of risks that could matter very quickly if the narrative shifts.
Final Thought
Markets are once again balancing on a knife-edge: equities are choppy but supported by AI-led optimism, while oil has eased back toward the mid-$90s on fragile hopes of U.S.-Iran talks, even as the ceasefire remains uncertain and sentiment stays headline-driven.
For now, markets are being held up by belief as much as fundamentalsm, but with geopolitics unresolved and volatility never far away, this remains a rally that can extend, yet one that demands respect for the risks beneath the surface.
Russell Shor
Senior Market Strategist
Russell Shor is a Senior Market Strategist at FXCM, having been promoted to the role in 2025 in recognition of his depth of insight and consistent delivery of high-impact market analysis. He originally joined FXCM in October 2017 as a Senior Market Specialist.
Russell holds an Honours Degree in Economics from the University of South Africa, is a certified FMVA®, and a full member of the Society of Technical Analysts (UK). With over 20 years of experience in financial markets, his work is renowned for its clarity, precision, and strategic value across asset classes.
Any opinions, news, research, analyses, prices, other information, or links to third-party sites contained on this website are provided on an "as-is" basis, as general market commentary and do not constitute investment advice. The market commentary has not been prepared in accordance with legal requirements designed to promote the independence of investment research, and it is therefore not subject to any prohibition on dealing ahead of dissemination. Although this commentary is not produced by an independent source, FXCM takes all sufficient steps to eliminate or prevent any conflicts of interests arising out of the production and dissemination of this communication. The employees of FXCM commit to acting in the clients' best interests and represent their views without misleading, deceiving, or otherwise impairing the clients' ability to make informed investment decisions. For more information about the FXCM's internal organizational and administrative arrangements for the prevention of conflicts, please refer to the Firms' Managing Conflicts Policy. Please ensure that you read and understand our Full Disclaimer and Liability provision concerning the foregoing Information, which can be accessed here.