
UKOil Breakout Gains Fundamental Support From Hormuz Disruption


UKOil's daily chart has shifted in favour of the bulls, with the technical improvement supported by renewed threats to physical oil supplies. The move is not yet beyond challenge, however, as resistance around $90-$92 still stands between the current recovery and a more decisive breakout.
The Technical Picture Has Turned Bullish
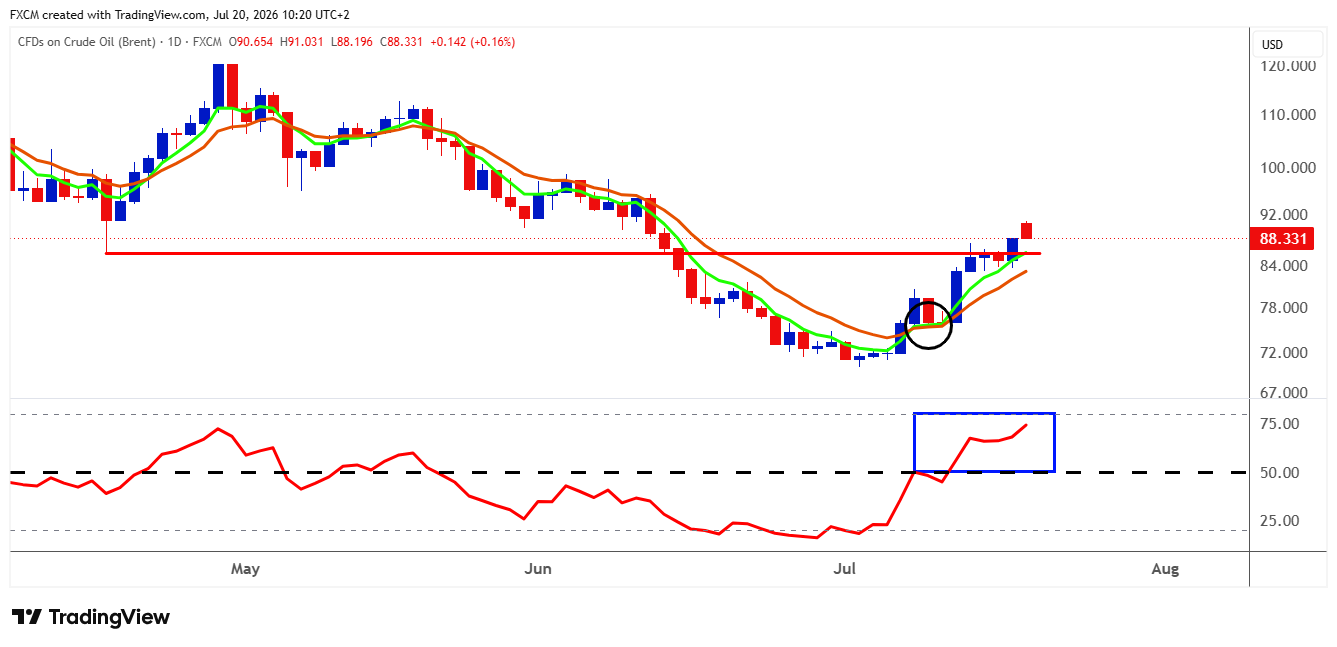
Price has reclaimed the $85-$86 region, which acted as support before the June breakdown. Under the principle of polarity, broken support frequently becomes resistance. UKOil's recovery through this area therefore matters. If buyers can defend it during a pullback, the former floor should revert to support, providing stronger evidence that this is a genuine breakout rather than another temporary rebound.
The exponential moving averages reinforce that interpretation. The faster EMA has crossed above the slower EMA, while both are rising and beginning to separate. Their increasing angle and separation suggest that the trend is gathering momentum. That carries considerably more weight than a crossover between flat, closely grouped averages in a sideways market.
Price also remains above both EMAs, preserving the emerging sequence of higher highs and higher lows. This represents an important short-term change in structure, although UKOil has not yet reversed the entire decline visible on the longer-term chart.
Momentum is also supportive. The RSI has moved decisively above its neutral 50 threshold and is approaching 70. The longer it remains above 50, the stronger the evidence that positive momentum is being sustained. An elevated reading may indicate that UKOil is becoming vulnerable to a temporary pullback, but it is not automatically a sell signal while price and the moving averages continue rising.
The immediate test is $90-$92, where the latest advance has encountered resistance. A sustained daily close above this region would provide stronger confirmation of the breakout and expose the broader $95-$100 resistance area. Within that range, $100 would represent the major psychological barrier.
A retreat that holds $85-$86 would not necessarily be bearish. In fact, it would provide a useful test of the polarity thesis. A decisive close below that region would weaken the argument, while a subsequent break beneath the slower EMA near $82-$83 would inflict more substantial damage on the bullish setup.
Hormuz Is Turning Technical Strength Into a Supply Story
The chart's improvement is being supported by renewed supply-risk pricing. UKOil briefly moved above $90 as US-Iran hostilities intensified and risks surrounding Gulf shipping deteriorated. US Central Command confirmed further strikes against Iranian targets and issued updated statements concerning American military casualties.
Iran, meanwhile, has renewed its threat to prevent energy shipments from passing through the Strait of Hormuz. This is not yet equivalent to proving that all traffic has stopped, but the deterioration is affecting physical shipping activity. Reuters, citing LSEG data, reported that only four vessels passed through the strait on Sunday, down from eight on Saturday. One day's traffic can be volatile, but the decline adds substance to the market's concerns.
Hormuz is exceptionally difficult to replace. Approximately 20 million barrels per day of crude oil and petroleum products passed through the strait before the conflict, while the capacity of alternative pipelines is limited. The International Energy Agency estimates that flows averaged only 2.7 million barrels per day during March, April and May. The disruption contributed to cumulative Middle Eastern supply losses exceeding 1.3 billion barrels.
June brought a partial recovery, but the headline inventory figures conceal a less comfortable picture. Global observed stocks rose by 21 million barrels, yet this increase was concentrated in oil at sea. Onshore inventories continued falling. OECD stocks declined by 62 million barrels, including an estimated 44 million barrels released from government reserves, while non-OECD crude stocks fell by another 37 million barrels.
Gulf production remained 11.4 million barrels per day below its pre-war level. Refined-product supply also recovered more slowly than crude exports, leaving fuel markets particularly exposed to renewed disruption. Against this background, another sustained reduction in tanker traffic could place fresh pressure on already depleted onshore inventories.
There are meaningful counterweights. The IEA expects global oil demand to decline by approximately 1 million barrels per day in 2026, while the US Energy Information Administration forecasts a contraction of 1.2 million barrels per day. The EIA also expects inventories to begin rebuilding once Gulf production and trade flows recover. Weak demand, restored supply and renewed inventory accumulation could therefore limit the rally if the conflict de-escalates.
That leaves the market with a fairly clear test. Threatening statements may create an immediate risk premium, but the more durable signal will be whether restricted tanker traffic produces renewed supply losses and further onshore inventory depletion.
For now, the technical and fundamental signals lean in the same direction. As long as UKOil holds above reclaimed support, the EMAs continue rising and separating, and the RSI remains above 50, the balance of probability favours higher prices. A convincing break through $90-$92 would strengthen that conclusion; failure to defend $85-$86 would place it under question.
References

Russell Shor
Senior Market Strategist
Russell Shor is a Senior Market Strategist at FXCM, having been promoted to the role in 2025 in recognition of his depth of insight and consistent delivery of high-impact market analysis. He originally joined FXCM in October 2017 as a Senior Market Specialist.
Russell holds an Honours Degree in Economics from the University of South Africa, is a certified FMVA®, and a full member of the Society of Technical Analysts (UK). With over 20 years of experience in financial markets, his work is renowned for its clarity, precision, and strategic value across asset classes.

Any opinions, news, research, analyses, prices, other information, or links to third-party sites contained on this website are provided on an "as-is" basis, as general market commentary and do not constitute investment advice. The market commentary has not been prepared in accordance with legal requirements designed to promote the independence of investment research, and it is therefore not subject to any prohibition on dealing ahead of dissemination. Although this commentary is not produced by an independent source, FXCM takes all sufficient steps to eliminate or prevent any conflicts of interests arising out of the production and dissemination of this communication. The employees of FXCM commit to acting in the clients' best interests and represent their views without misleading, deceiving, or otherwise impairing the clients' ability to make informed investment decisions. For more information about the FXCM's internal organizational and administrative arrangements for the prevention of conflicts, please refer to the Firms' Managing Conflicts Policy. Please ensure that you read and understand our Full Disclaimer and Liability provision concerning the foregoing Information, which can be accessed here.