
Oil Tests Critical Support as Hormuz Flows Recover Unevenly


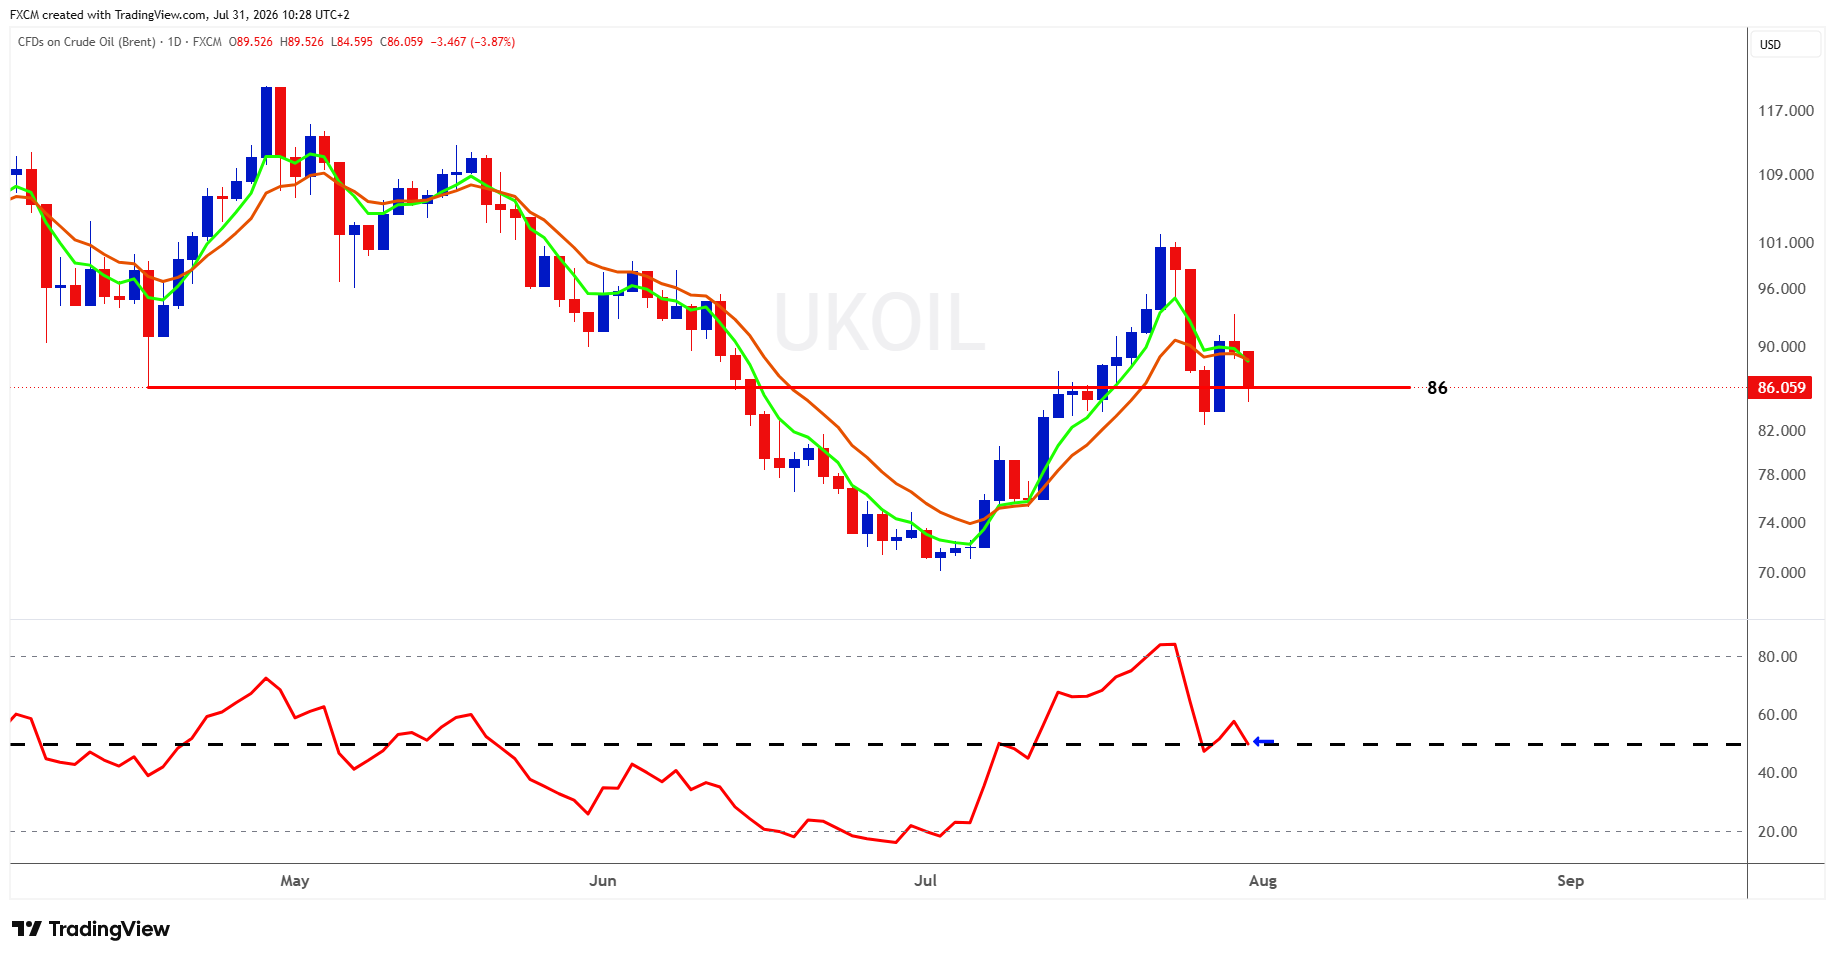
UKOil's daily chart has weakened after its advance from roughly $70 was rejected near $101. The first rebound then stalled around $90-91, creating a lower high, while price slipped below both moving averages. RSI has also fallen from above 80 to around 50, indicating that the earlier bullish momentum has faded. The $84.50-$86 area is now the key support zone. A daily close below $84.50 would increase the risk of a decline towards $82 and then $78, while a recovery above $90-91 would provide the first sign that the correction is stabilising.
Fundamentals also help explain the latest weakness, although the recovery in regional shipping remains uneven rather than signalling a straightforward reopening of the Strait of Hormuz. Traffic is estimated to have returned to around 30%-35% of pre-war levels.
Twelve commodity vessels crossed the strait on Wednesday, while an LNG carrier completed the first such exit since 11 July. However, only two tankers crossed on Thursday, even as 25 commodity vessels passed through Bab el-Mandeb. This suggests that regional energy flows are improving intermittently rather than returning steadily to normal.
Freight rates and war-risk insurance costs also remain elevated, meaning the threat of renewed disruption is still reflected in prices. Washington adds another source of uncertainty, with proposed legislation allowing targeted tariffs on the largest buyers of Russian energy and preserving certain Iran-related sanctions, while President Trump has separately called for tariff powers against Iran.
Overall, UKOil remains technically vulnerable below $90-91, although another serious disruption to Gulf shipping could quickly restore the supply premium and overturn the bearish setup.

Russell Shor
Senior Market Strategist
Russell Shor is a Senior Market Strategist at FXCM, having been promoted to the role in 2025 in recognition of his depth of insight and consistent delivery of high-impact market analysis. He originally joined FXCM in October 2017 as a Senior Market Specialist.
Russell holds an Honours Degree in Economics from the University of South Africa, is a certified FMVA®, and a full member of the Society of Technical Analysts (UK). With over 20 years of experience in financial markets, his work is renowned for its clarity, precision, and strategic value across asset classes.

Any opinions, news, research, analyses, prices, other information, or links to third-party sites contained on this website are provided on an "as-is" basis, as general market commentary and do not constitute investment advice. The market commentary has not been prepared in accordance with legal requirements designed to promote the independence of investment research, and it is therefore not subject to any prohibition on dealing ahead of dissemination. Although this commentary is not produced by an independent source, FXCM takes all sufficient steps to eliminate or prevent any conflicts of interests arising out of the production and dissemination of this communication. The employees of FXCM commit to acting in the clients' best interests and represent their views without misleading, deceiving, or otherwise impairing the clients' ability to make informed investment decisions. For more information about the FXCM's internal organizational and administrative arrangements for the prevention of conflicts, please refer to the Firms' Managing Conflicts Policy. Please ensure that you read and understand our Full Disclaimer and Liability provision concerning the foregoing Information, which can be accessed here.