Inverted yield curve deepens over recession fears
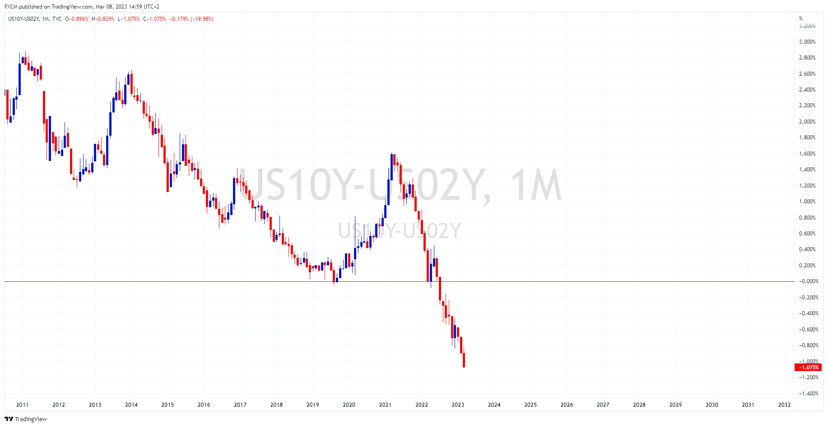
The 2s-10s yield curve has been inverted for 9-months and is currently at -107 bps. The last time the yield curve was this far into inversion territory was in the early 1980s. An inverted yield curve often forewarns of an economic recession, as it suggests that investors expect short-term interest rates to fall, and normalise the curve. This can be a signal that the economy is headed for a downturn.
Yield curves invert when the yields on long-term bonds fall below the yields on short-term bonds of the same credit quality. It is when short-term interest rates are higher than long-term interest rates. Normally, the yield curve is upward sloping, so longer-term bonds have higher yields than shorter-term bonds. This is because investors demand a higher yield for tying up their money for a longer period.
However, when the yield curve inverts, it is a sign of economic trouble. This is because investors essentially signal that they are more concerned about the short-term economic outlook than the long-term outlook. Investors are demanding higher compensation for holding short-term bonds because of the perceived risk of economic instability sooner rather than later. In contrast, longer-term bonds are a more stable investment and investors will accept lower yields for greater security.
Also, the Fed is influencing short-term interest rates through their hawkish monetary policy. The inversion spiked down yesterday as Fed Chair Powell sounded more hawkish than anticipated in his testimony before the senate. The market fears that the probabilities of a hard landing have increased as the Fed looks to tighten further.
Russell Shor
Senior Market Strategist
Russell Shor is a Senior Market Strategist at FXCM, having been promoted to the role in 2025 in recognition of his depth of insight and consistent delivery of high-impact market analysis. He originally joined FXCM in October 2017 as a Senior Market Specialist.
Russell holds an Honours Degree in Economics from the University of South Africa, is a certified FMVA®, and a full member of the Society of Technical Analysts (UK). With over 20 years of experience in financial markets, his work is renowned for its clarity, precision, and strategic value across asset classes.
Any opinions, news, research, analyses, prices, other information, or links to third-party sites contained on this website are provided on an "as-is" basis, as general market commentary and do not constitute investment advice. The market commentary has not been prepared in accordance with legal requirements designed to promote the independence of investment research, and it is therefore not subject to any prohibition on dealing ahead of dissemination. Although this commentary is not produced by an independent source, FXCM takes all sufficient steps to eliminate or prevent any conflicts of interests arising out of the production and dissemination of this communication. The employees of FXCM commit to acting in the clients' best interests and represent their views without misleading, deceiving, or otherwise impairing the clients' ability to make informed investment decisions. For more information about the FXCM's internal organizational and administrative arrangements for the prevention of conflicts, please refer to the Firms' Managing Conflicts Policy. Please ensure that you read and understand our Full Disclaimer and Liability provision concerning the foregoing Information, which can be accessed here.