Bitcoin sets up as value-pattern on H4 timeframe

Source: www.tradingview.com
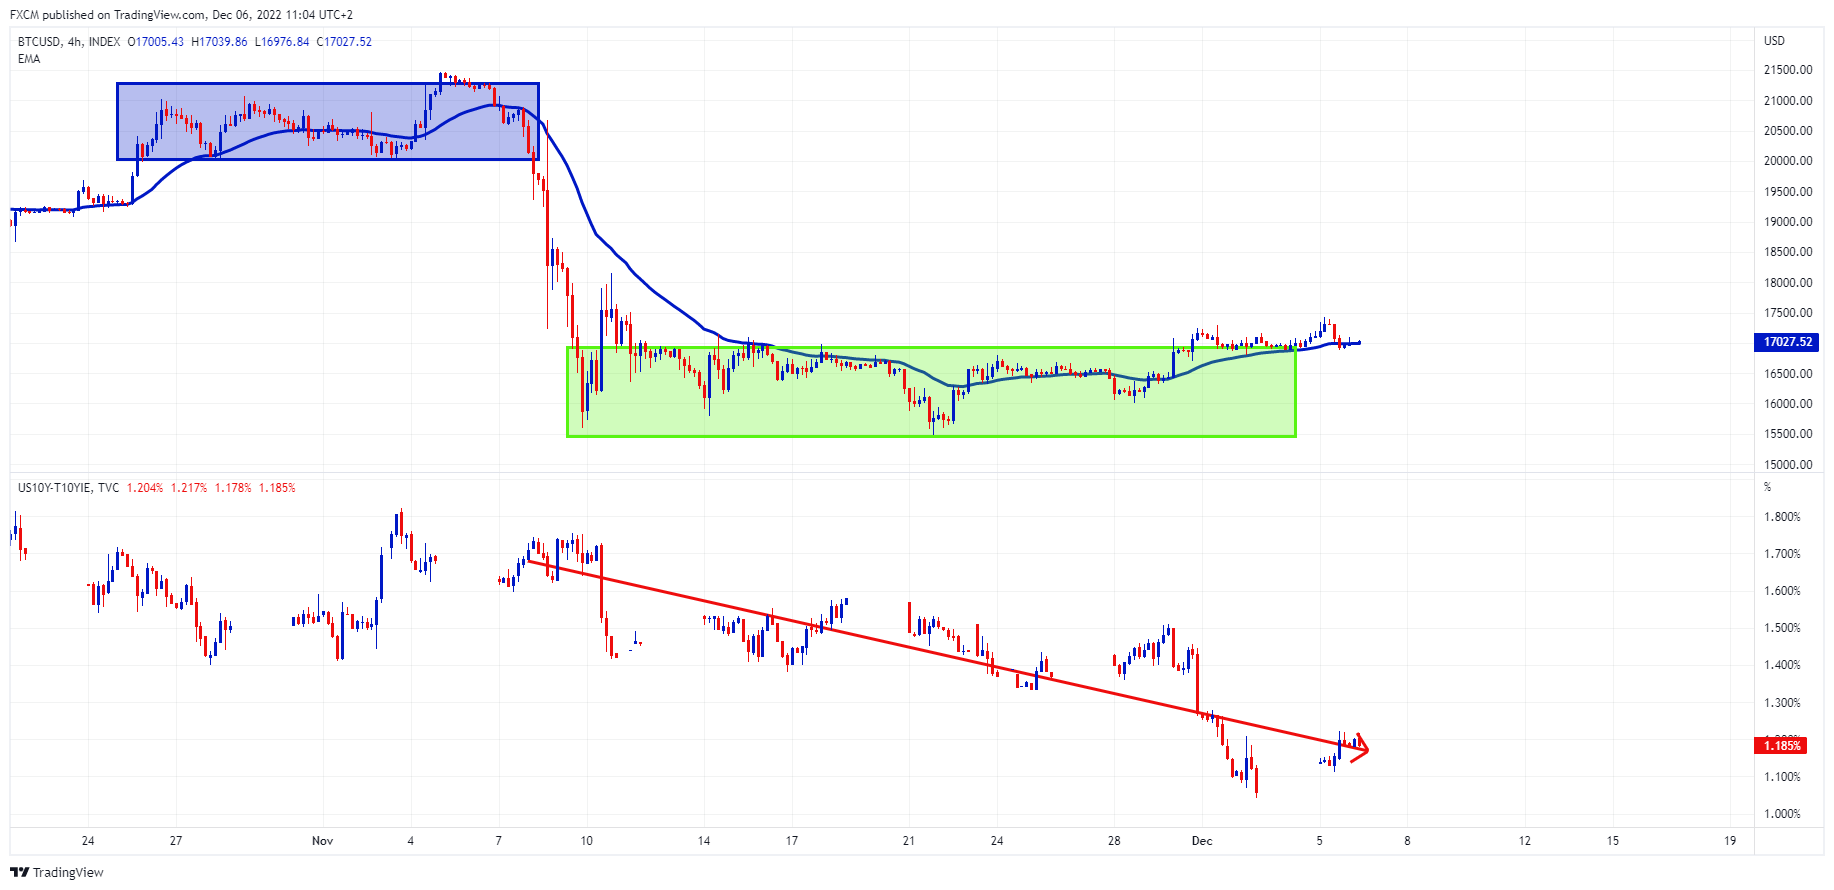
The bitcoin H4 chart shows a value-type pattern. It charted a sideways distribution from the last week of October into the first week of November (blue-shaded area). After which bitcoin dropped from the 20K range to the 16K range, a decline of around 20%.
Since then, the cryptocurrency has shown signs of accumulation (the green-shaded area). As a result, it has now broken to the upside and is looking to trade above its blue 30-period EMA.
The accumulation occurred when the US 10-year real rate declined (red arrow bottom chart). If the real rate continues to trend down, it will provide a tailwind to bitcoin given its pricing in dollars. I.e. a lower real rate generally translates into less demand for the greenback. Moreover, capital will likely be rotating to risk assets, including BTCUSD.
The danger here is the wage inflation rate. Average hourly earnings surprised to the upside on Friday, and the Fed won't allow this to become entrenched. However, one data point does not make a trend. So if the upside beat is a one-off anomaly, and the real rate continues to fall, bitcoin may very well be on the bullish radar.
Russell Shor
Senior Market Strategist
Russell Shor is a Senior Market Strategist at FXCM, having been promoted to the role in 2025 in recognition of his depth of insight and consistent delivery of high-impact market analysis. He originally joined FXCM in October 2017 as a Senior Market Specialist.
Russell holds an Honours Degree in Economics from the University of South Africa, is a certified FMVA®, and a full member of the Society of Technical Analysts (UK). With over 20 years of experience in financial markets, his work is renowned for its clarity, precision, and strategic value across asset classes.
Any opinions, news, research, analyses, prices, other information, or links to third-party sites contained on this website are provided on an "as-is" basis, as general market commentary and do not constitute investment advice. The market commentary has not been prepared in accordance with legal requirements designed to promote the independence of investment research, and it is therefore not subject to any prohibition on dealing ahead of dissemination. Although this commentary is not produced by an independent source, FXCM takes all sufficient steps to eliminate or prevent any conflicts of interests arising out of the production and dissemination of this communication. The employees of FXCM commit to acting in the clients' best interests and represent their views without misleading, deceiving, or otherwise impairing the clients' ability to make informed investment decisions. For more information about the FXCM's internal organizational and administrative arrangements for the prevention of conflicts, please refer to the Firms' Managing Conflicts Policy. Please ensure that you read and understand our Full Disclaimer and Liability provision concerning the foregoing Information, which can be accessed here.