Bitcoin remains in primary uptrend despite headwinds

Bitcoin and Yields
Source: www.tradingview.com
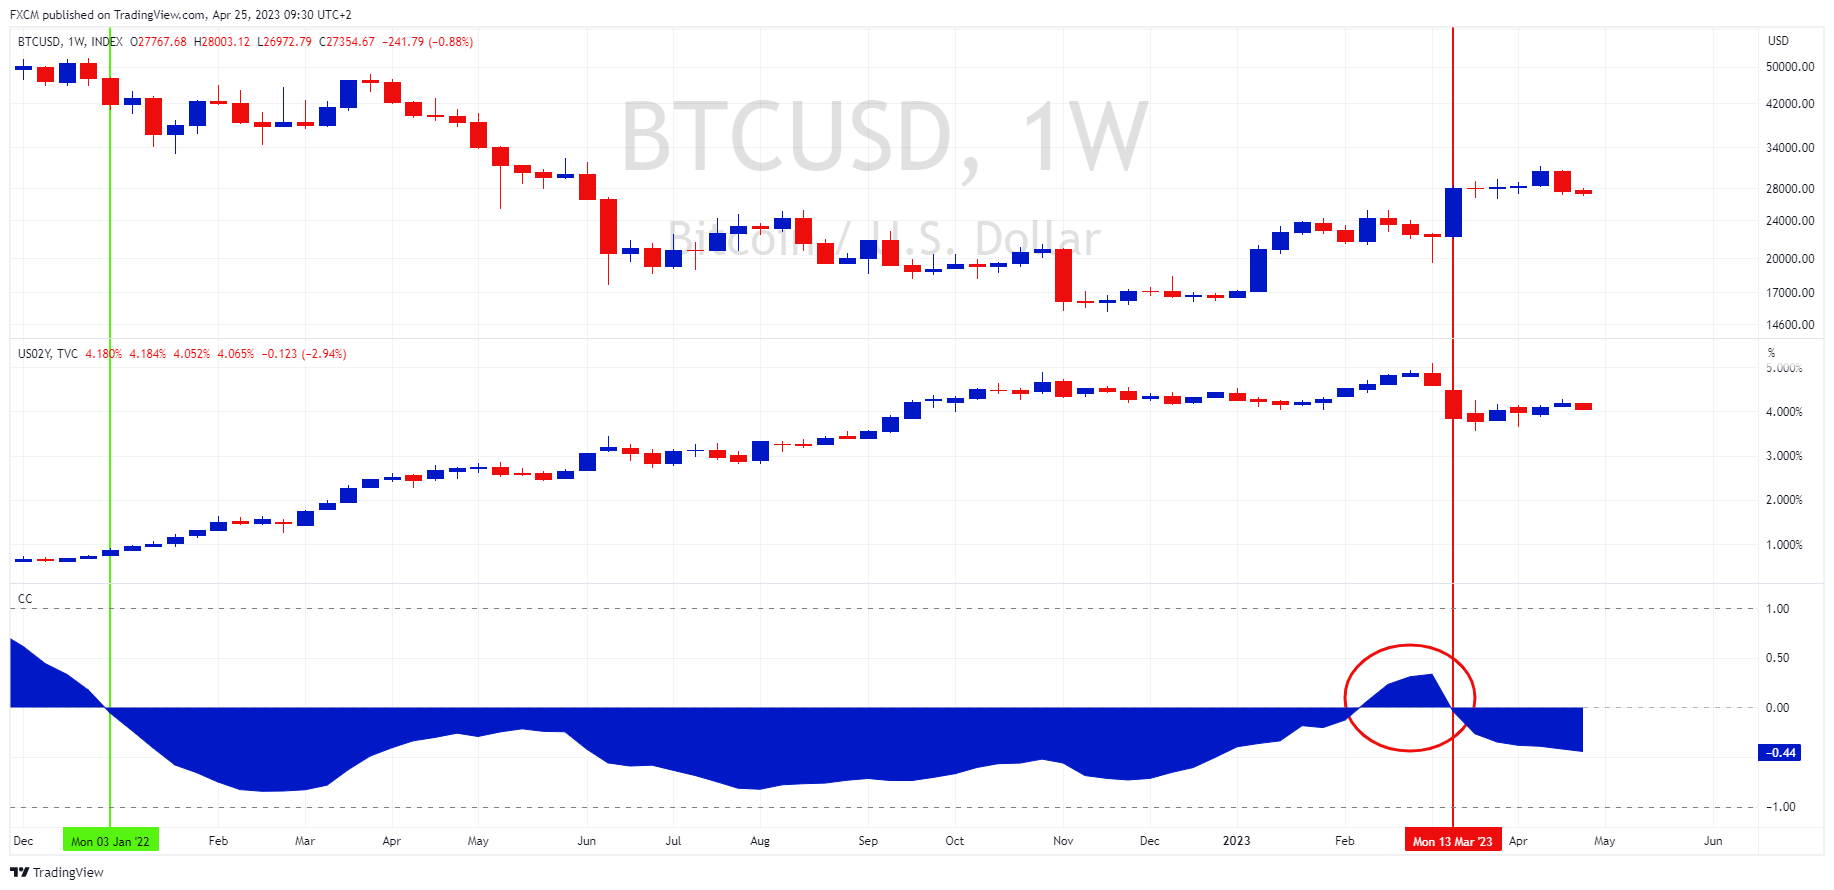
The top candlestick chart shows BTCUSD and the candlestick chart underneath is the US 2-year yield.
The US 2-year yield is a good measure for Fed monetary policy. As the Fed has been tightening, so the US 2-year yield has been rising. This is because the short end of the yield curve reacts quickly to changes in borrowing costs.
The bottom indicator is the correlation coefficient between BTCUSD and the US 2-year yield. It turned negative at the week of Monday, 3 Jan 2022 (green vertical) and has mostly maintained this relationship since. I.e., bitcoin and yields have trended in opposite directions.
There was a short break in the correlation earlier this year (red ellipse). However, the banking confidence crisis sparked off by the failure of SVB bank resulted in yields dropping sharply and the negative correlation reasserting (red vertical) i.e., bitcoin has appreciated. The Fed is near the apex of its rate hiking cycle and there is speculation that the latter part of 2023 will deliver rate cuts. This is BTCUSD supportive.
Bitcoin Weekly Analysis
.png)
The weekly chart is a good measure of an instrument's primary trend. BTCUSD has charted a series of higher troughs followed by higher peaks, which indicates that its primary trend is up.
The green trendline measures the momentum from the first trough to next higher trough, which was charted during December of 2022. Interestingly, once the next higher trough, charted in March 2023, was validated by its accompanying higher peak, the gradient of the trendline shifted from the green trendline to orange trendline. I.e., the uptrend's momentum increased.
The weekly RSI is positioned on the bullish side of 50 (green rectangle). As longs as it maintains on this side of 50, the underlying momentum is positive and price supportive.
Bitcoin Daily Analysis – Potential Dip in Uptrend
.png)
$30,000 is a psychological resistance level. Bitcoin tested this in early April but was unable to breakout. Since then, it has pulled back into its weak area between the lower blue and red bands.
We have added Bollinger bands to the daily RSI, which creates adaptive overbought and oversold levels. The pullback in bitcoin has been accompanied by the RSI dipping below its adaptive oversold level (red ellipse). The last time the RSI registered as oversold in March 2023 (green ellipse), bitcoin was able to power ahead and challenge the $30,000 level.
I.e., there is a potential dip in the primary uptrend.
Regulatory Pressures
There is regulatory pressure that bitcoin and other cryptocurrencies face. The regulation of decentralized finance (DeFi) platforms, which are crucial in cryptocurrency trading, may be reinforced by a proposal put forth by the SEC, according to recent reports.
Summary
- Bitcoin is inversely related to yields.
- The yield cycle potentially supports bitcoin.
- Bitcoin's primary trend is up.
- It has dipped in the short-term.
- This suggests a possible dip in the primary uptrend.
- Bitcoin and cryptocurrencies face regulatory pressure.
Russell Shor
Senior Market Strategist
Russell Shor is a Senior Market Strategist at FXCM, having been promoted to the role in 2025 in recognition of his depth of insight and consistent delivery of high-impact market analysis. He originally joined FXCM in October 2017 as a Senior Market Specialist.
Russell holds an Honours Degree in Economics from the University of South Africa, is a certified FMVA®, and a full member of the Society of Technical Analysts (UK). With over 20 years of experience in financial markets, his work is renowned for its clarity, precision, and strategic value across asset classes.
Any opinions, news, research, analyses, prices, other information, or links to third-party sites contained on this website are provided on an "as-is" basis, as general market commentary and do not constitute investment advice. The market commentary has not been prepared in accordance with legal requirements designed to promote the independence of investment research, and it is therefore not subject to any prohibition on dealing ahead of dissemination. Although this commentary is not produced by an independent source, FXCM takes all sufficient steps to eliminate or prevent any conflicts of interests arising out of the production and dissemination of this communication. The employees of FXCM commit to acting in the clients' best interests and represent their views without misleading, deceiving, or otherwise impairing the clients' ability to make informed investment decisions. For more information about the FXCM's internal organizational and administrative arrangements for the prevention of conflicts, please refer to the Firms' Managing Conflicts Policy. Please ensure that you read and understand our Full Disclaimer and Liability provision concerning the foregoing Information, which can be accessed here.