Best Practices of Successful Traders

Money management is a core element of successful trading. In this regard, several key traits must be included in a trading plan to boost the chances of success. These include:

  1. Cut losses, let profits run.
  2. Use leverage effectively
  3. Trade the right time of day.

Trait 1: Successful Traders Cut Losses, Let Profits Run

This trait is a cornerstone of trading success. However, it is one of the most challenging behaviours to incorporate. Nevertheless, without it, the odds of success lengthen significantly. Consider the following table:

Table 1

Percentage Loss Breakeven Percentage
10% 11.11%
20% 25%
30% 42.86%
40% 66.67%
50% 100%
60% 150%
70% 233.34%
80% 400%
90% 900%

The more a trader loses, the more is required to get back to breakeven. As per table 1, it becomes impossible to recover if too much is lost.

Breakeven percentage

Therefore, to become a successful trader, it is essential not to lose too much money.

Trait 1 encapsulates in a metric referred to as the risk-reward ratio.

A risk-reward of 1 implies that a trader is willing to risk $1 to make $1, whilst a risk-reward of 2 means that the trader is willing to risk $1 to make $2. The higher the value, the greater the likelihood of trading successfully. Consider the following example:

There are two traders, Tom and Jerry. Both take ten trades, and both score wins on 3 of those. Unfortunately, they also both lose on 7 of their trades. Tom's risk-reward is 1, but Jerry's is much better at 3.

Table 2

Tom Jerry
Loss per trade $1 $1
Gain per trade $1 $3
After seven losses $7 $7
After three wins $3 $9
Net position after ten trades -$4 (loss) +$2 (gain)

The higher risk-reward ratio enables Jerry to remain profitable even though his winning percentage is 30%.

An excellent risk-reward ratio relieves pressure regarding a trader's winning percentage of trades.

There is a clear relationship between the risk-reward ratio and the winning percentage of trades. Considering both these variables enables traders to tweak their systems to run at a positive expectancy.

Breakeven Pofit Zone

Chart 1 shows the minim win % on the x-axis and the corresponding risk-reward ratio on the y-axis needed to break even (excluding costs). A trader must ensure that they trade above the breakeven curve to be profitable. The curve labels show the win % first and then the corresponding risk-reward ratio. E.g., 50%; 1 stipulates that at a 50% win percentage and a risk-reward of 1, a trader will be on the breakeven curve (excluding costs) etc.

This observation implies that a trader below the breakeven curve is incurring losses. To rectify this, they need to adjust their y-axis or x-axis position. Most traders look for a better method to push their win % up. However, professional traders often consider the more appropriate approach is to toggle the y-axis and the risk-reward ratio. This preference is because there is no perfect system, and all systems will experience a drawdown period.

Therefore, in our above example, if Tom improved his risk-reward ratio, his net position automatically improves, all other things being equal. He may make this improvement through adjustments to stop-loss and take-profit levels.

Trait 2: Use Leverage Effectively

Many traders come to the forex market for the wide availability of leverage — the ability to control a trading position more considerable than your available capital. However, while using high leverage has the potential to increase your gains, it can, just as quickly and, more importantly, magnify your losses.

In this regard, we refer back to table 1. If leverage results in a significant loss, achieving the breakeven percentage is much more difficult. Moreover, leverage may result in a loss size that makes breakeven impossible.

Given the asymmetry between losses and profits, it should be as little a surprise that profitability tends to decrease as effective leverage increases. Consider this example:

Tom and Jerry each open a 10K account and look to trade EUR/USD (MMR $26 per 1K). Both use a 1:2 risk-reward ratio with a stop at 100 and a limit at 200. However, they use two different leverage ratios.

Tom Jerry
30:1 Leverage 10:1 Leverage
Buy 300k trade Buy 100k trade
MMR: $7,800 MMR: $2,600
Usable Margin: $2,200 Usable Margin: $7,400
PIP Value: $30 PIP Value: $10

But EUR/USD trades down, falling 60 pips. At the end of the trading day:

Tom Jerry
Loss: $1,800 Loss: $600
Remaining Usable Margin: $400 Remaining Usable Margin: $6,800

Above both Tom and Jerry experience the same pip decline. However, Tom's position is highly levered and suffered a much higher loss. Recovery from this position will be harder for Tom than for Jerry.

Which trader is more likely to deviate from the initial plan?

When the trade went against Tom, it didn't have room to draw down, and the usable margin quickly evaporated, pushing him close to a margin call. Jerry has appropriate leverage (and stops and limits) to allow the trade space to move back into favour.
Ultimately, the same move in the market cost Tom three times what it cost Jerry.
The higher the leverage, the greater risked on each trade. Besides the financial burden, the heavier loss likely amplifies irrational decision-making. I.e., there is a psychological burden as well.

Since profitability tends to decrease as effective leverage increases, the logical result is a positive correlation between average equity in an account and trading performance. This result is because undercapitalised accounts tend to assume a leverage position too big to withstand.

To this end, we propose a money management formula to align trading positions with account size. Whilst the formula is not absolute, and there are other risk management methods, it is a good starting point for traders to test their potential exposures:

(Trading account size x 2%)/pips to stop loss = # mini-lot position

Assuming a $10,000 account and a 50 pip stop loss:

  • (10,000x2%)/50 = 4 mini lots or 40,000 units of base currency
  • 2% is a risk control mechanism.
  • Larger or smaller accounts may adjust this.
  • However, remember that the larger this is, the harder it will be to recover after a drawdown (as per table 1).

Trait 3: Successful Traders Trade the Right Time of Day

Our data on trader performance shows that traders, on average, have a lower win percentage during volatile market hours and when trading through faster-moving markets. But, conversely, traders fair better when average pip movements are smaller, yielding higher win percentages. This attribute intuitively makes sense because there is a positive correlation between risk and reward. I.e., the higher the risk, the higher the reward. Or, to put it another way, if there is no risk present, it will be impossible to profit.

Thus, there is an inherent lure if the risk is present. Traders focus on the potential reward, not the actual risk. However, the risk is a genuine and present variable. There are many ways to measure risk, with one of the most popular being standard deviation or volatility.

When a financial instrument's standard deviation increases, its volatility increases, i.e., its risk increases. As such, there are critical times during a trading day when volatility will increase. For example, in the NFP release, volatility/risk is expected. Moreover, currency pairs have their unique risk characteristics. For instance, JPY volatility will respond to different calendar events than EUR or GBP.

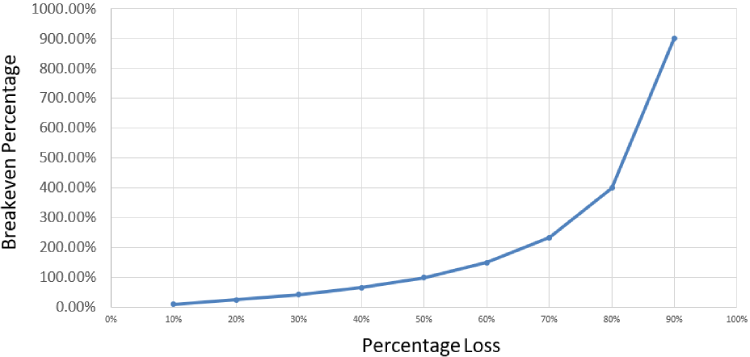
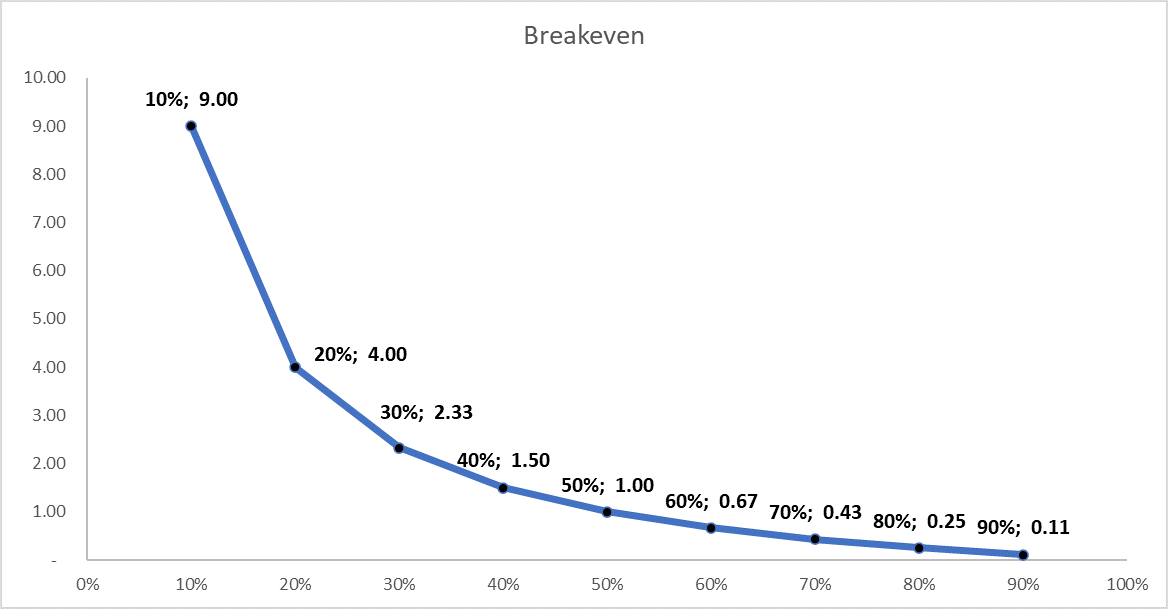
Traders should consider the time of day because volatility increases the chance of loss. If the volatility is extreme, the loss suffered will burden recovery (refer to table 1).

Conclusion

All three traits are linked and connected. Looking after one will have a flow-through effect on the others. Therefore, when a trader focuses on all three qualities, it makes for a responsible approach to trading the markets. Moreover, trading has become a more measured and proficient endeavour. In effect, the trader treats trading as a business, not a pastime.

Disclosure

High Risk Investment Warning: Trading foreign exchange on margin carries a high level of risk, and may not be suitable for all investors. The high degree of leverage can work against you as well as for you. Before deciding to trade foreign exchange you should carefully consider your investment objectives, level of experience, and risk appetite. The possibility exists that you could sustain a loss in excess of your deposit and therefore you should not invest money that you cannot afford to lose. You should be aware of all the risks associated with foreign exchange trading, and seek advice from an independent financial advisor if you have any doubts. Please read our full risk warning.

Friedberg Direct is a division of Friedberg Mercantile Group Ltd. , a member of the Investment Industry Regulatory Organization of Canada (IIROC), the Canadian Investor Protection Fund (CIPF), and all Canadian Exchanges. Friedberg Mercantile Group Ltd. is headquartered at Friedberg Direct, 220 Bay Street, Suite 600, Toronto, Ontario, M5J 2W4, Canada.

Accounts are opened with and are held by Friedberg Direct which clears trades through a subsidiary within the FXCM group of companies (collectively, the "FXCM Group"). Customers of Friedberg Direct may, in part, be serviced through subsidiaries within the FXCM Group. The FXCM Group does not own or control any part of Friedberg Direct and is headquartered at 20 Gresham Street, 4th Floor, London EC2V 7JE, United Kingdom.

Derivatives offered to Quebec residents are authorized by the Quebec AMF.

Please note the information on this website is primarily intended for retail customers.

Market Opinions: Any opinions, news, research, analyses, prices, other information, or links to third-party sites contained on this website are provided as general market commentary and do not constitute investment advice. The market commentary has not been prepared in accordance with legal requirements designed to promote the independence of investment research, and it is therefore not subject to any prohibition on dealing ahead of dissemination. Friedberg Direct will not accept liability for any loss or damage including, without limitation, to any loss of profit which may arise directly or indirectly from use of or reliance on such information.

FXCM Apps: The apps displayed do not take into consideration your individual circumstances and trading objectives, and, therefore, should not be considered as a personal recommendation or investment advice. Past performance is not indicative of future results.

Hypothetical/Simulated Performance: These results are based on simulated or hypothetical performance results that have certain inherent limitations. Unlike the results shown in an actual performance record, these results do not represent actual trading. No representation is being made that any account will or is likely to achieve profits or losses similar to these being shown. Simulated or hypothetical trading programs are generally designed with the benefit of hindsight, do not involve financial risk, and possess other factors which can adversely affect actual trading results.

Forecasts are not a reliable indicator of future performance.

Order Execution Only

Order Execution Only

Regulatory Documents:
IIROC Brochure: How Can I Get My Money Back, How IIROC Protects Investors, IIROC Complaints Brochure, CIPF Brochure, CIPF Coverage Policy, IIROC Order Execution Only Bulletin, Conflict Disclosure Statement, Covid-19 and Cyber Security - Tips for Investors, Relationship Disclosure Information Document, Before You Begin Trading

The relationship between Friedberg Direct and FXCM was formed with the purpose to allow Canadian residents access to FXCM's suite of products, while maintaining their accounts with a regulated Canadian firm. All accounts are opened by and held with Friedberg Direct, a division of Friedberg Mercantile Group Ltd., a member of the Investment Industry Regulatory Organization of Canada (IIROC). Friedberg customer accounts are protected by the Canadian Investor Protection Fund within specified limits. A brochure describing the nature and limits of coverage is available upon request or at www.cipf.ca.

${getInstrumentData.name} / ${getInstrumentData.ticker} /

Exchange: ${getInstrumentData.exchange}

${getInstrumentData.bid} ${getInstrumentData.divCcy} ${getInstrumentData.priceChange} (${getInstrumentData.percentChange}%) ${getInstrumentData.priceChange} (${getInstrumentData.percentChange}%)

${getInstrumentData.oneYearLow} 52/wk Range ${getInstrumentData.oneYearHigh}